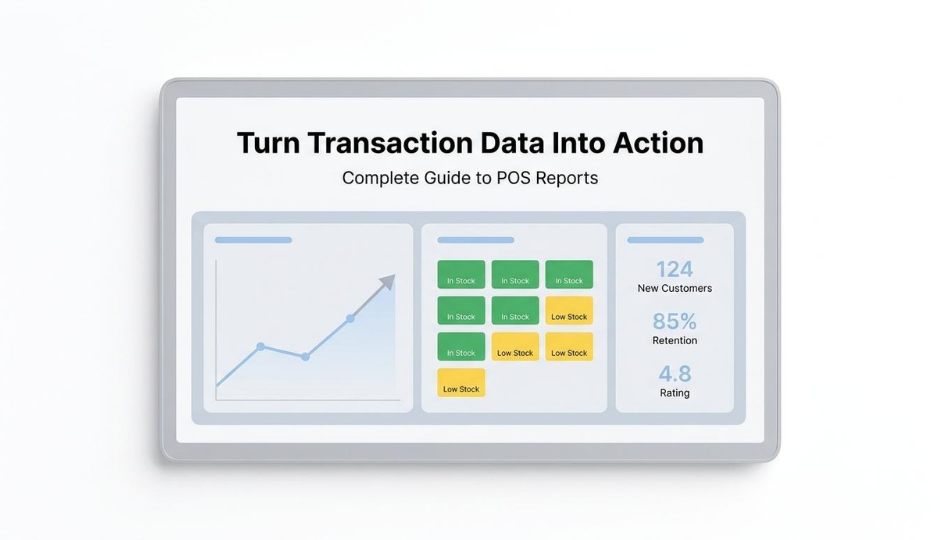
A point-of-sale (POS) report is a summary generated by a POS system that shows what sold, how much revenue was collected, and how inventory, customers, and staff performed over a defined period. We use these reports to convert raw transaction data into patterns that guide purchasing, staffing, pricing, and retention decisions.
This guide covers report types and their functions, interpretation methods for key metrics, must-have reporting features, review cadence, inventory and retention applications, and the operational cost of siloed data.
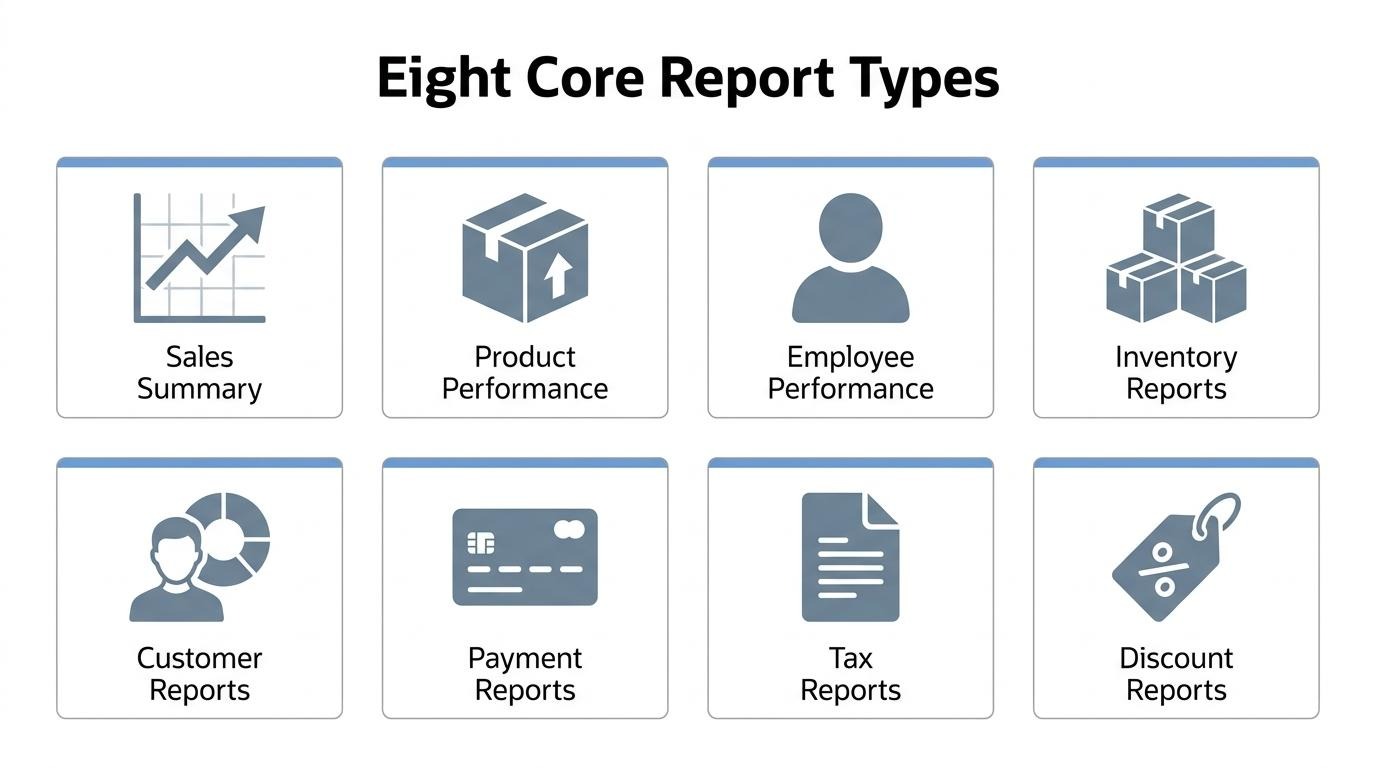
POS reports span eight distinct types, including sales summaries, product performance, employee productivity, inventory, customer, payment, tax, and discount reports. Each isolates a specific dimension of retail operations so teams can act on precise data rather than aggregate guesses.
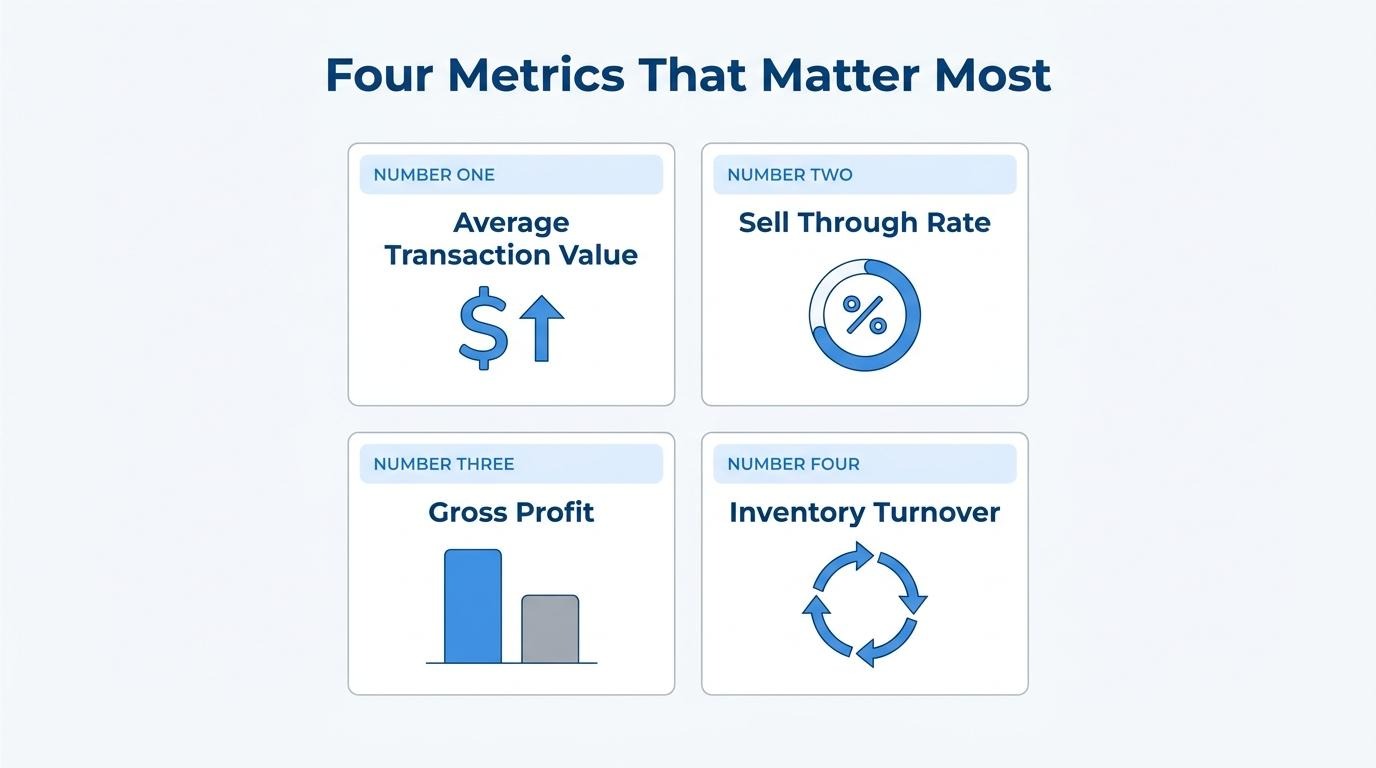
Reading these reports starts with core metrics like average transaction value, sell-through rate, and inventory turnover, then moves to trend comparison across periods and anomaly detection for shrinkage or fraud signals.
The features that separate functional reporting from guesswork include real-time data access, multi-location customization, unified online-offline views, and filtering granular enough to reach the SKU or customer-segment level.
Inventory management relies on aging reports that surface dead stock at 60, 90, or 120 days, while customer retention strategies use RFM analysis and purchase frequency tracking to trigger personalized re-engagement before churn compounds.
When POS and ecommerce data live in separate systems, retailers face inventory distortions and manual reconciliation overhead. Unified commerce platforms solve this by routing all channels into a single source of truth.
A POS report tracks transaction-level data across sales, inventory, customers, staff, and payments. The subsections below cover the specific data points captured and why retailers depend on this information for daily decisions.
A POS report captures sales totals, payment method breakdowns, product performance by SKU, inventory levels, customer purchase history, staff productivity metrics, taxes collected, discounts applied, and refund counts. Multi-location businesses also pull data across all stores into a single reporting view.
Key data categories include:
Real-time reporting enables immediate adjustments in staffing or inventory without waiting for end-of-day summaries. Stockouts, which represent lost revenue and often a lost customer, become visible at the SKU level so teams can act before patterns repeat.
Retailers rely on POS reports for decision-making because these reports convert raw transaction data into actionable patterns that guide staffing, purchasing, pricing, and promotions.
According to Scantranx, a simple weekly routine includes:
This structured cadence prevents reactive decision-making. Rather than guessing which products need reorders or which promotions eroded margin, retailers reference concrete numbers tied to a defined period. For operators managing multiple channels or locations, this discipline is what separates data-informed scaling from gut-driven decisions that compound cost over time.
Understanding what POS reports track sets the foundation for recognizing the specific report types available.
The types of POS reports are sales summaries, product performance, employee performance, inventory, customer, payment and transaction, tax, and discount and promotion reports. Each type isolates a specific dimension of retail operations.
Sales summary reports offer a clear, concise snapshot of a shop's key sales metrics over a selected time period. Modern POS systems present total sales by day, week, or month in formats that are easy to understand at a glance. A retail manager might use a daily sales summary to assess the previous day's performance, identifying peak sales hours to optimize staffing for the next day. These reports function like a detailed recap after a period closes, covering total revenue, best-selling items, and staff performance.
Product performance reports provide insights into how each product is selling, including units sold, average selling price, sales mix by category, and week-over-week comparisons. According to Scantranx, these reports also surface seasonality patterns that inform buying decisions. A boutique owner might review this report to identify best-sellers and slow movers, then reorder popular items while creating promotions for stagnant inventory. For brands managing large catalogs, this is often the single most actionable report for protecting margins.
Employee performance reports track sales figures per staff member to evaluate productivity. A store manager uses these reports to identify top-performing associates, then models their techniques for training the broader team. This level of detail remains an underserved area in competitor content, which tends to focus heavily on sales and inventory while leaving employee productivity tracking as an afterthought. Tying individual performance to revenue gives operators a direct lever for coaching and incentive design.
Inventory reports provide real-time tracking of stock levels, identifying when to restock and managing inventory movement across locations. These reports flag items approaching reorder thresholds and surface dead stock before it ties up capital. For retailers operating both physical stores and online channels, inventory reporting becomes the connective tissue that prevents overselling and stockouts simultaneously.
Customer reports analyze new versus returning customers, often including RFM (Recency, Frequency, Monetary) analysis to understand loyalty and purchasing behavior. By segmenting buyers based on how recently they purchased, how often they return, and how much they spend, retailers can identify VIP customers and at-risk segments requiring re-engagement. This report type bridges the gap between raw transaction data and actionable retention strategy.
Payment and transaction reports reconcile cash drawers and track payment methods to balance accounts at the end of each day. A finance department uses these reports to verify that all payment types, such as cash, credit, and mobile, are accurately recorded and reconciled. According to Interface, these reports also help identify discrepancies or potential fraud by surfacing mismatches between expected and actual totals.
Tax reports break down taxes collected by jurisdiction, giving retailers a clear view of what they owe to state, county, and city tax authorities. A business owner uses tax reports to accurately file sales taxes, ensuring compliance with local and national regulations. For multi-location retailers selling across state lines, this report eliminates guesswork during filing periods.
Discount and promotion reports summarize the total value of discounts applied, allowing retailers to assess how promotional strategies affect sales and profitability. According to Xenial's documentation, these reports help determine whether campaigns drove sufficient volume to justify the margin reduction. A marketing manager reviews this data after a promotional campaign to evaluate whether discounts led to acceptable profit margins or eroded profitability too much.
With each report type addressing a distinct operational dimension, understanding how to read and interpret the data within them becomes the next practical step.
You read a POS report by focusing on core financial and operational metrics first, then comparing those figures across time periods to spot trends, and finally investigating any data points that fall outside expected ranges.
The key metrics you should focus on first are average transaction value, sell-through rate, gross profit, and inventory turnover. Average transaction value (ATV) is calculated by dividing total revenue by the number of transactions during a defined period. Sell-through rate reveals which products overperform or underperform, calculated as (units sold / starting inventory) × 100. Gross profit shows total revenue minus cost of goods sold, while net profit subtracts all expenses including rent, utilities, and taxes. Inventory turnover measures how many times stock has been sold and replaced, calculated as cost of goods sold divided by average inventory. According to Shopify, GMROI (gross margin return on investment) indicates inventory profitability by dividing gross profit by average inventory cost.
For most retailers, ATV and sell-through rate deliver the fastest actionable insights because they connect directly to both pricing strategy and buying decisions.
You identify trends across reporting periods by comparing the same metrics over consistent timeframes, such as month-over-month, quarter-over-quarter, or year-over-year. Year-over-year growth is calculated as [(current year's sales − previous year's sales) / previous year's sales] × 100, which isolates seasonal effects. According to Shopify, tracking month-over-month or quarter-over-quarter sales growth provides early warnings of problem areas or falling sales.
POS reports also uncover trends like changes in SKU velocity across locations, enabling quick action on reorders or markdowns. Comparing shorter intervals reveals operational shifts; comparing longer intervals confirms whether those shifts represent lasting patterns or temporary fluctuations.
Anomalies or outliers in a POS report indicate potential issues such as inventory shrinkage, process errors, theft, or unusual demand spikes. Shrinkage is calculated as (inventory recorded − physical inventory) / inventory recorded, with causes including administrative errors, misplaced inventory, shoplifting, and employee theft. According to Posim, regularly comparing physical stock with system totals helps retailers identify anomalies caused by shipment errors or shoplifting, as well as account for damaged items.
Sudden spikes in voids, refunds, or discount frequency may signal employee misuse or system glitches. Unexpected sales surges on specific SKUs can indicate viral demand or pricing errors that require immediate verification.
With interpretation skills in place, choosing the right reporting features ensures your POS system surfaces these insights automatically.
The top POS reporting features to look for are real-time data access, multi-location customization, unified online-offline views, and granular filtering. Each capability determines how quickly and precisely you can act on transaction data.
Yes, the system should offer real-time reporting. Real-time reporting allows immediate access to data, enabling quick adjustments in staffing or inventory without waiting for end-of-day summaries. This capability is especially critical for omnichannel operations. According to KIBO, a comprehensive Order Management Solution (OMS) is the backbone for a unified commerce experience, which is crucial for omnichannel reporting. Any delay in data availability creates a window where decisions rely on outdated information, making real-time access a non-negotiable feature for scaling retailers.
Yes, you can customize reports by location or channel. Businesses that run several locations need reliable data across all of them, which requires multi-location reporting capacity. Customizable reports let you isolate performance by individual store, sales channel, or region. This granularity reveals which locations drive margin and which channels underperform, preventing aggregate numbers from masking location-specific problems.
Yes, it should integrate online and in-store data in one view. A unified reporting view eliminates the need to manually merge spreadsheets from separate systems. When ecommerce and physical register data feed into a single dashboard, you see total customer behavior across touchpoints. Without this integration, inventory counts diverge, customer profiles fragment, and promotional impact becomes impossible to measure holistically. For brands operating across multiple channels, this single-source-of-truth approach is arguably the feature that separates functional reporting from guesswork.
The filtering and segmentation options should be granular enough to isolate specific metrics at the SKU, time period, staff member, and customer segment level. Granular data, such as basket size and return rates, empowers retailers to build highly targeted, high-conversion campaigns rather than relying on generic top-line metrics. Look for systems that let you filter by:
With the right filtering capabilities identified, the next step is establishing how often to review these reports.
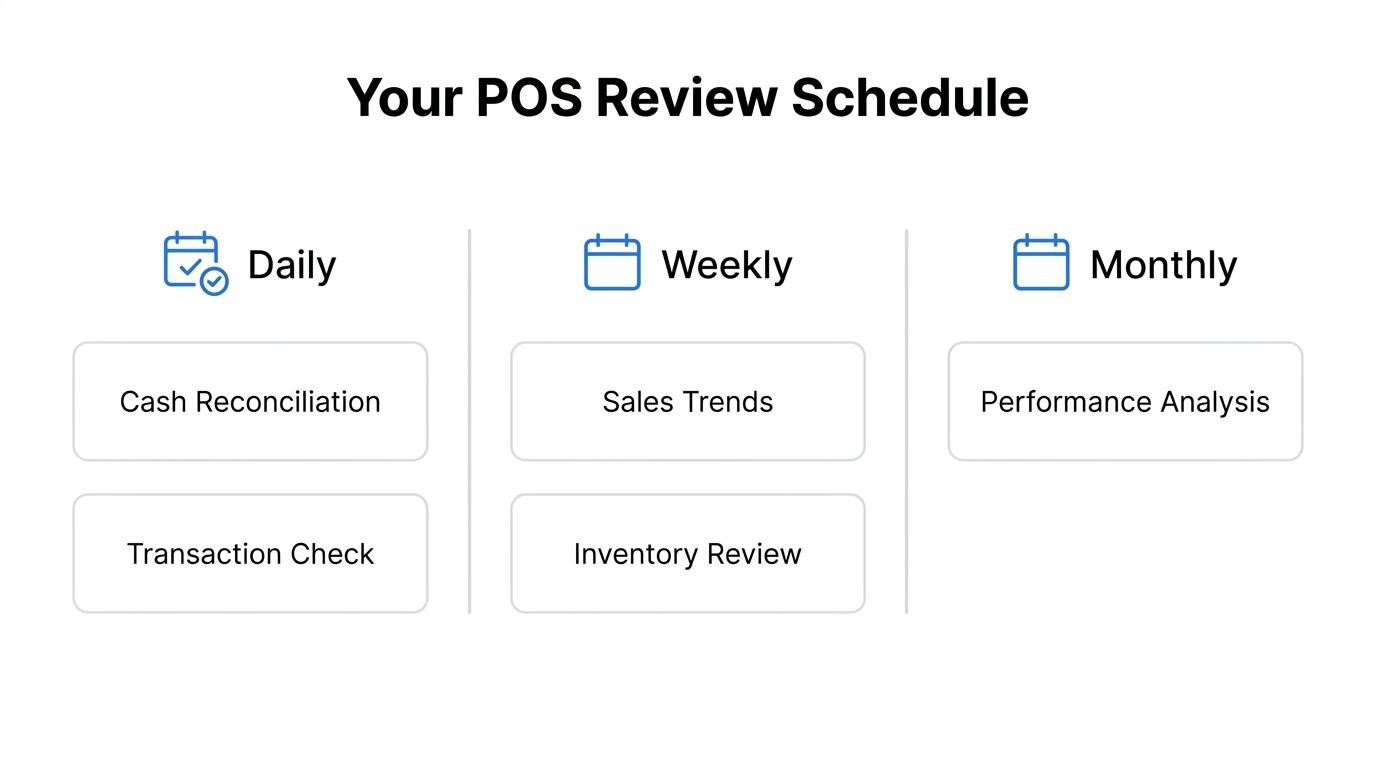
You should review POS reports daily for cash reconciliation, weekly for sales and inventory trends, and monthly for strategic planning. The ideal cadence depends on which metrics you are tracking.
According to Scantranx, a simple weekly routine for retailers includes reviewing sales by category, checking best sellers, confirming low stock, reviewing margin and discount percentages, pulling inventory aging reports, reviewing returns, and planning for the next week. Daily checks catch discrepancies before they compound, while monthly and quarterly reviews reveal seasonal patterns and year-over-year growth trajectories.
A recommended review schedule:
For most scaling retailers, the weekly cadence delivers the highest return on time invested because it balances actionable detail with enough data volume to reveal meaningful patterns.
Understanding review frequency sets the stage for distinguishing static reports from live dashboards.
The difference between POS reports and analytics dashboards is timing and purpose. POS reports summarize historical data after a period closes, while analytics dashboards display live operational metrics as they happen.
POS reports function like end-of-day summaries. They compile completed transactions into structured snapshots covering total sales, best-selling products, and staff performance for a defined period. Retailers use these to evaluate what already happened and plan accordingly.
Analytics dashboards, by contrast, show what is happening right now. According to Livelytics.ai, real-time analytics displays live inventory levels and current sales versus daily targets as they unfold. This immediacy enables mid-shift adjustments rather than next-day reactions.
For most scaling retailers, both tools serve distinct roles: reports drive strategic planning and trend analysis, while dashboards support in-the-moment operational decisions. The two complement each other rather than compete.
With this distinction clear, the next step is applying POS report data to specific operational challenges like inventory control.
POS reports help with inventory management by revealing stock movement patterns, identifying dead inventory, and flagging discrepancies between recorded and physical counts. The sections below cover aging analysis, anomaly detection, and stockout prevention.
Inventory aging reports serve as a profit tool, showing how long products have been sitting without moving. These reports identify items with no sales in 60, 90, or 120 days, or categories carrying heavy stock but low velocity. According to Scantranx, this visibility helps retailers implement markdowns or bundling strategies before stagnant inventory becomes a total loss.
Comparing physical stock with system totals on a regular basis allows retailers to identify anomalies caused by shipment errors or shoplifting, as well as account for damaged items. This reconciliation process catches shrinkage early, before small discrepancies compound into significant losses across locations or seasons.
For brands managing both online and in-store channels, inventory control becomes exponentially harder when data lives in separate systems. Retailers who treat POS inventory reports as a weekly discipline, rather than a quarterly audit, consistently maintain tighter stock levels and fewer missed sales opportunities.
With inventory visibility established, the next step is using POS data to strengthen customer retention.
POS reports improve customer retention strategies by enabling teams to segment customers, personalize outreach, and reward loyalty based on actual purchase behavior. The following details explain how these reports translate transaction data into retention tactics.
According to Lightspeed, purchase history allows for tailoring recommendations to individual preferences, and loyalty programs can be created to reward relevant behavior rather than offering generic discounts. Marketing teams analyze customer reports to segment buyers based on purchase history and frequency, then create targeted loyalty programs and personalized campaigns to increase retention.
Tracking purchase frequency and average order value helps identify VIP customers. When a loyal shopper's spending habits decline, automated re-engagement campaigns can be triggered to win them back. Unified customer profiles that follow shoppers across every channel and location ensure sales history and loyalty status remain accessible for a seamless experience.
For brands operating at scale, retention is where POS data delivers compounding value; the difference between a generic 10%-off email and a behavior-triggered campaign tied to actual purchase cadence is often the difference between churn and lifetime loyalty.
With retention strategies built on POS data, the next question is what happens when that data lives separately from your ecommerce system.
When POS data lives separately from ecommerce data, retailers face inventory distortions, manual reporting overhead, and revenue loss from stockouts and overselling. Below, we cover how unified platforms solve this and the key takeaways from this guide.
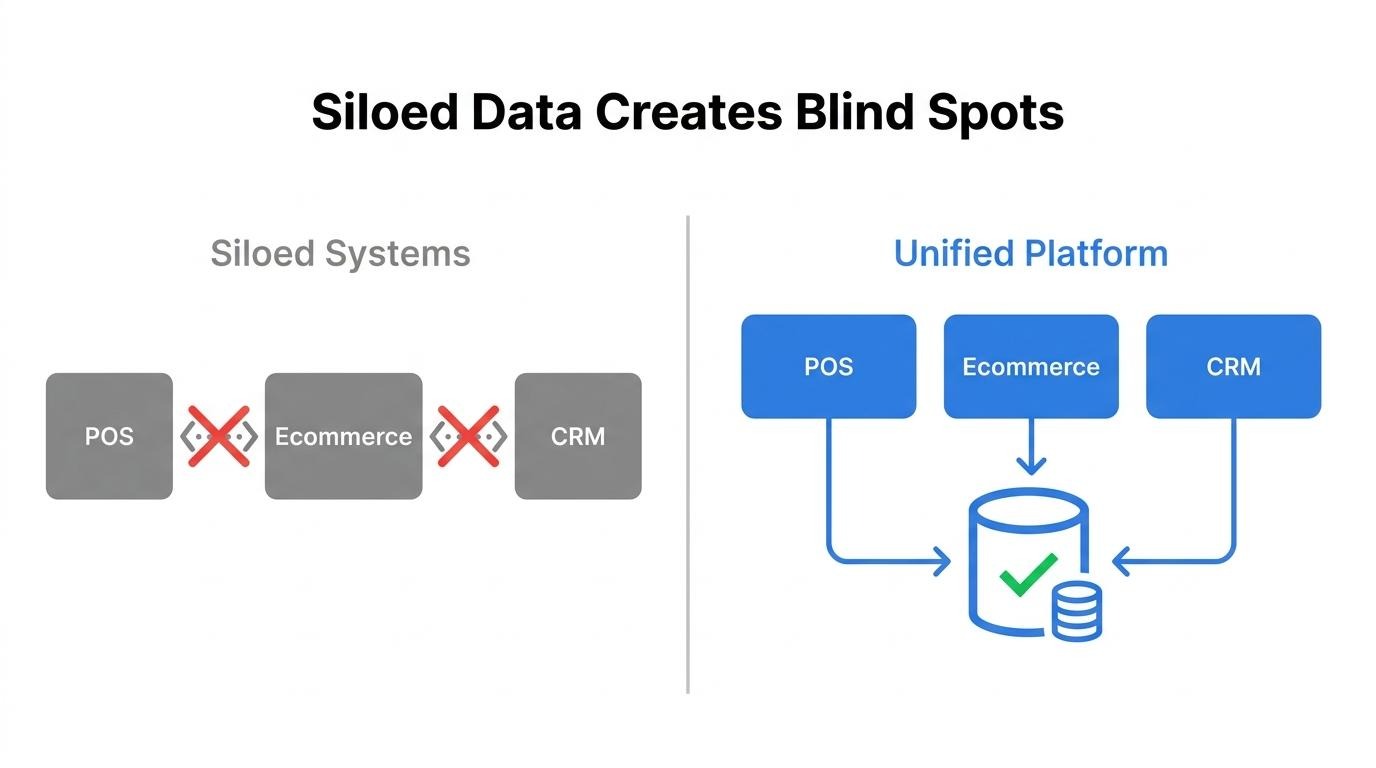
SHOPLINE unifies online and offline reporting by routing all transactions through a single platform where commerce, CRM, and POS share one customer data layer. Rather than syncing separate systems overnight or reconciling spreadsheets manually, product, order, and customer data flow into one source of truth natively.
According to IHL Group, the global retail industry loses $1.73 trillion annually from out-of-stocks and overstocks, problems that worsen when inventory counts only update overnight across disconnected systems. SHOPLINE's native omnichannel architecture eliminates the delayed syncing that causes overselling, because online and in-store stock reflect the same real-time pool. For brands operating at scale across multiple channels, consolidating reporting into one system removes a category of operational risk that no amount of manual reconciliation can fully solve.
The key takeaways about POS reports are:
Brands that consolidate reporting into a unified commerce platform gain a complete picture of performance without stitching tools together.