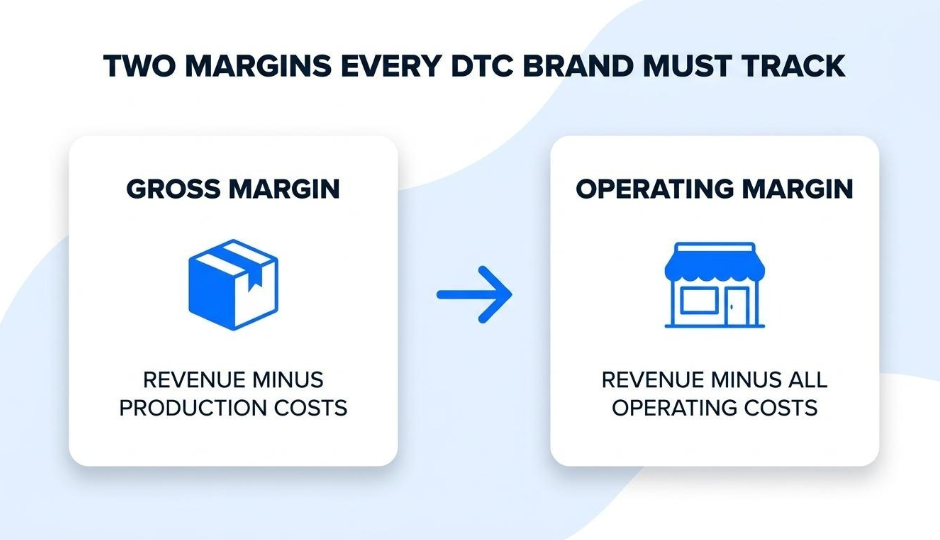
Gross margin is the percentage of revenue remaining after subtracting direct production costs; operating margin is the percentage remaining after subtracting both production costs and all day-to-day operating expenses. Together, these two ratios reveal whether a brand's products are profitable and whether the business itself is profitable.
This guide covers definitions and formulas for both metrics, the specific costs each margin captures, vertical benchmarks for ecommerce brands, the operational factors that widen the gap between them, and strategies for improving each ratio as a DTC business scales.
Gross margin measures production-level profitability by isolating cost of goods sold, including raw materials, manufacturing labor, inbound freight, and packaging. It sets the ceiling for every downstream layer of profit, making it the first metric worth stress-testing before layering on growth spending.
Operating margin goes further by accounting for marketing spend, fulfillment labor, software subscriptions, rent, and salaries. Two brands with identical gross margins can report very different operating margins, because this ratio exposes how efficiently overhead converts production profit into actual business profit.
Benchmarks vary significantly by vertical. Fashion and beauty brands typically carry gross margins above 50%, while food and beverage brands operate between 25% and 45%. Operating margins across ecommerce generally fall between 3% and 15%, depending on category and cost structure.
The gap between both margins is where the most actionable insight lives. Ecommerce firms tend to carry lower COGS but higher other operating costs than traditional retailers, meaning strong gross margins can mask unsustainable spending on acquisition, fulfillment, or fragmented software. Monitoring both ratios together prevents that blind spot.
Gross margin is the percentage of revenue remaining after subtracting the direct costs of producing or purchasing products. It reveals how efficiently a business converts sales into profit before accounting for operating expenses, taxes, or interest.
Gross margin measures production-level profitability. The formula divides gross profit by total revenue:
Gross Margin = Gross Profit ÷ Revenue
Gross profit itself is the difference between net sales and cost of goods sold (COGS). As the University of Virginia's Foundations of Commerce curriculum explains, gross profit is the amount a company earns after paying to produce or buy its products but before deducting operating expenses.
For ecommerce brands, COGS typically includes raw materials, manufacturing labor, inbound freight, packaging, and duties. A higher gross margin signals stronger pricing power or lower production costs relative to revenue; a lower one suggests tight supplier economics or heavy discounting.
This metric matters because it sets the ceiling for every other layer of profitability. No amount of operational efficiency can compensate for a gross margin too thin to cover rent, payroll, marketing, and software. For scaling DTC brands in particular, gross margin is the first number worth stress-testing before layering on growth spending.
Operating margin is a profitability ratio that measures how much profit a company retains from each dollar of revenue after subtracting both cost of goods sold and all operating expenses. It reveals whether day-to-day business operations generate sustainable profit before interest, taxes, and non-operating items enter the picture.
Operating margin equals operating profit divided by revenue. Where gross margin stops at production costs, operating margin goes further by accounting for selling, general, and administrative expenses (SG&A), marketing spend, rent, software subscriptions, and other overhead required to run the business.
According to OpenStax's Principles of Finance (2022), after gross profit is calculated, other operating expenses are deducted to arrive at operating income, also commonly called income from operations. This sequential relationship means operating margin always sits at or below gross margin on the income statement, and the gap between the two ratios exposes how efficiently a brand controls its overhead.
For ecommerce brands, operating margin captures costs that gross margin ignores: customer acquisition spend, fulfillment labor, platform fees, and the accumulated subscriptions from multi-tool tech stacks. A brand can post a healthy 60% gross margin yet still operate near breakeven if these expenses consume the difference. That visibility makes operating margin one of the most practical indicators of whether growth is actually profitable, not just revenue-generating.
Understanding where operating margin fits in the broader margin hierarchy sets the stage for calculating both ratios side by side.
You calculate gross margin by dividing gross profit by revenue, and operating margin by dividing operating profit by revenue. Each formula isolates a different layer of profitability, covered below.
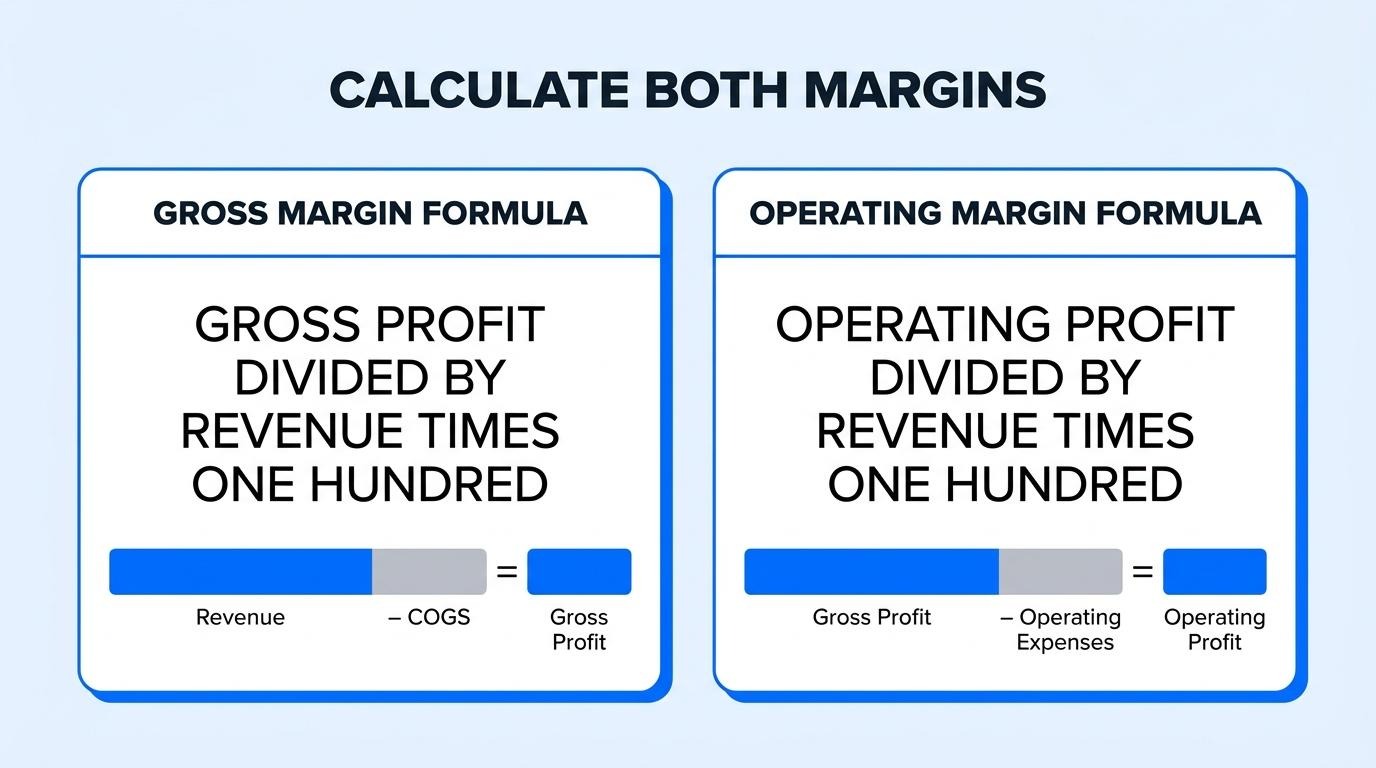
You calculate gross margin by dividing gross profit by total revenue, then multiplying by 100 to express it as a percentage. The formula is:
Gross Margin (%) = (Gross Profit ÷ Revenue) × 100
Gross profit itself equals revenue minus cost of goods sold. According to LibreTexts' financial ratio analysis curriculum, the gross profit margin examines how much gross profit is generated by each dollar of revenue using the formula: gross profit margin = gross profit / revenue.
If a brand earns $500,000 in revenue and spends $200,000 on COGS, gross profit is $300,000. Gross margin is 60%. This single ratio reveals whether core product economics are healthy before any operating expenses enter the picture.
You calculate operating margin by dividing operating profit by total revenue, then multiplying by 100. The formula is:
Operating Margin (%) = (Operating Profit ÷ Revenue) × 100
Operating profit is derived from gross profit after subtracting all operating expenses. As OpenStax's Principles of Finance explains, after gross profit is calculated, other operating expenses are deducted to arrive at the firm's income from operations, also commonly called operating income. These operating expenses include marketing, rent, software, salaries, and fulfillment costs.
If that same brand with $300,000 in gross profit spends $200,000 on operating expenses, operating profit is $100,000 and operating margin is 20%. The gap between gross margin and operating margin is where operational efficiency lives, making it one of the most diagnostic comparisons in ecommerce finance.
Gross margin includes only direct production costs, while operating margin captures those same costs plus all day-to-day business expenses. The subsections below break down what falls into cost of goods sold versus operating expenses.
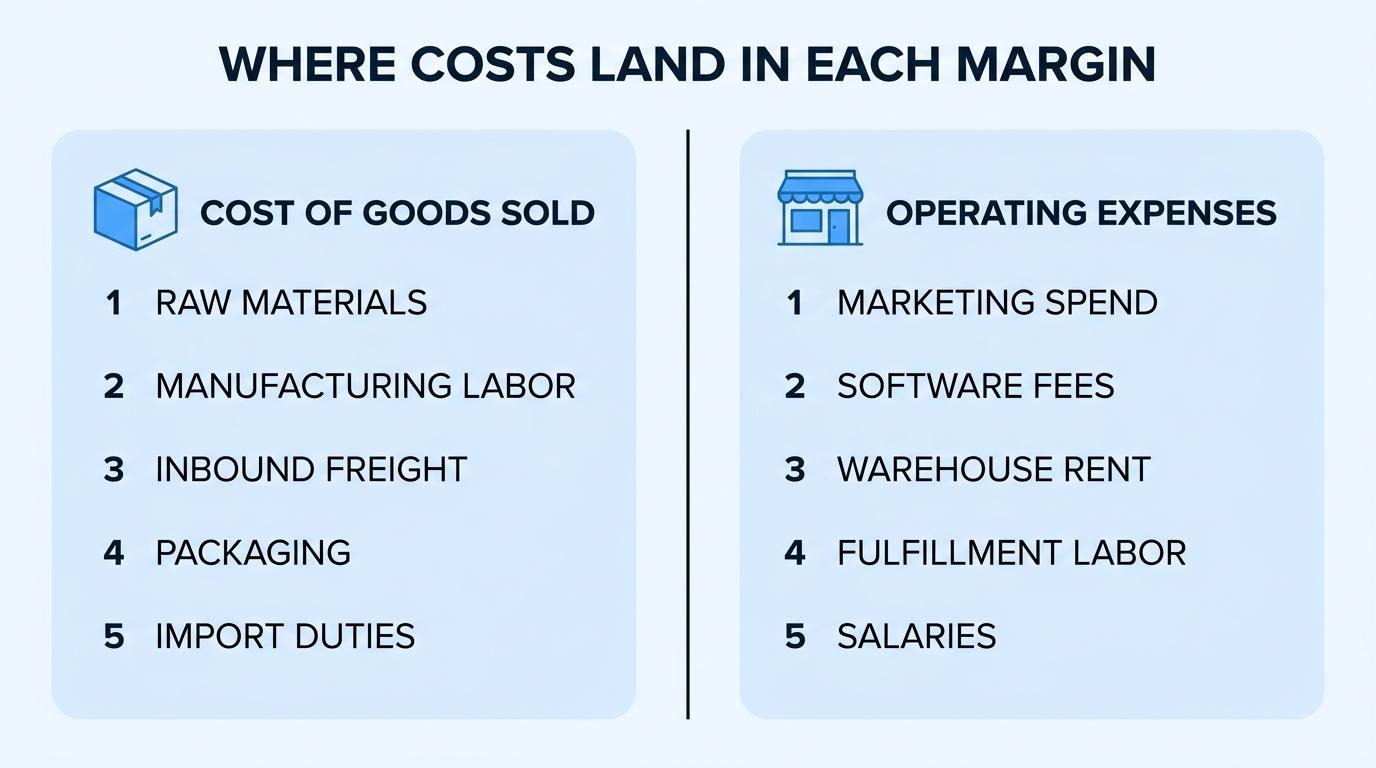
Cost of goods sold (COGS) in gross margin covers every direct expense tied to producing or purchasing products before any operating expenses are deducted. According to the University of Virginia's Foundations of Commerce curriculum, gross profit is the difference between net sales and cost of goods sold.
Typical COGS line items include:
A peer-reviewed study published in Electronic Commerce Research using European firm data from 2010 to 2019 found that ecommerce firms carry a lower share of COGS than traditional retailers, offset by higher other operating costs. This cost structure distinction makes accurate COGS classification especially important for online brands; misallocating an operating expense into COGS inflates gross margin and hides true production economics.
Operating margin captures every recurring business expense beyond COGS, including selling, general, and administrative costs. In 2024, the IFRS Foundation announced that IFRS 18 introduces three defined categories for income and expenses (operating, investing, and financing) and requires all companies to present an operating profit subtotal on the income statement.
Common operating expenses that sit below gross profit include:
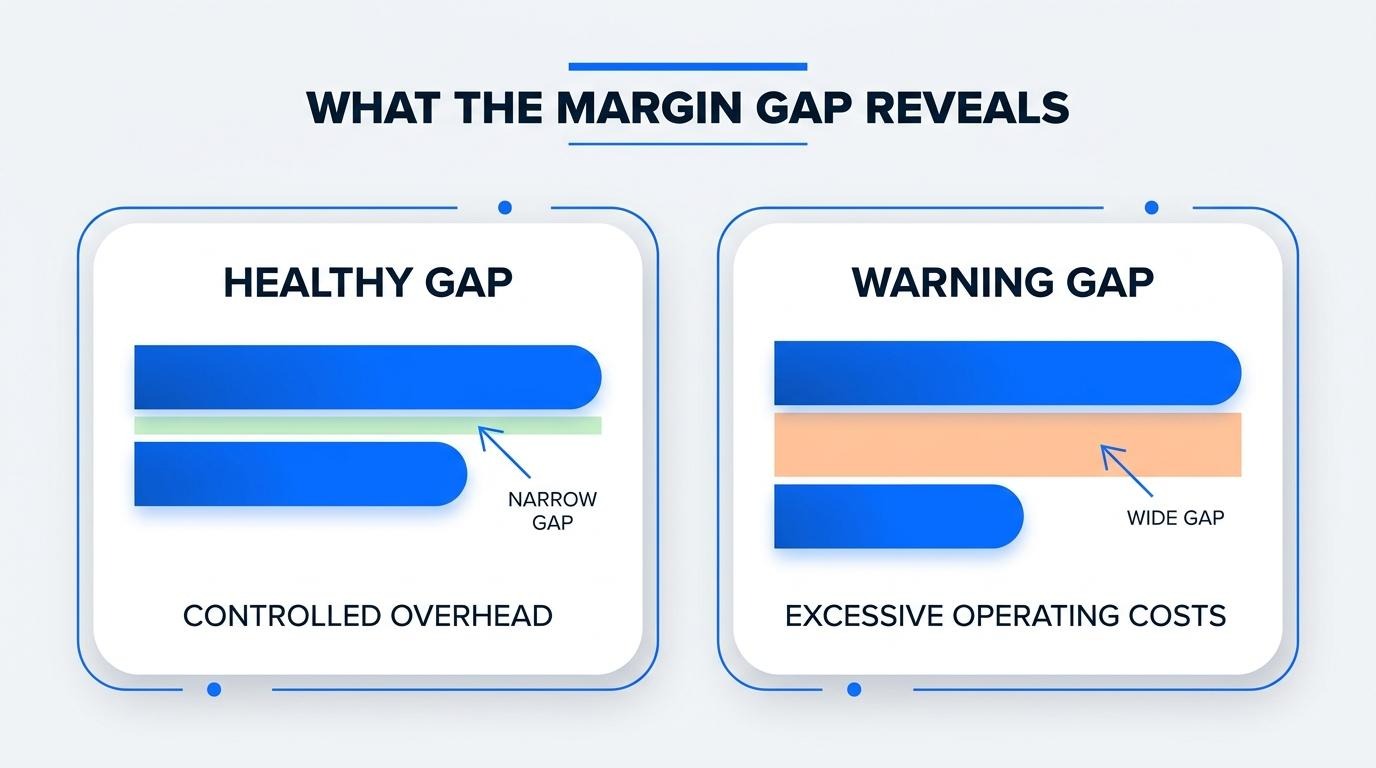
Because these costs are excluded from gross margin, two brands with identical gross margins can report very different operating margins. The gap between the two metrics reveals how efficiently a brand converts production profit into actual business profit, which is often where scaling DTC companies face the most pressure.
Understanding which costs land in each margin category sets the stage for evaluating why a wide spread between them signals trouble.
The gap between gross margin and operating margin matters because it reveals how much of a brand's production profit is consumed by operating expenses before any net income remains. A narrow gap signals operational efficiency; a wide gap exposes hidden cost drains in marketing, fulfillment, software, or overhead.
A 2022 peer-reviewed study published in Electronic Commerce Research found that ecommerce firms have a different cost structure than traditional retail firms, with a lower share of labor costs and cost of goods sold but a higher share of other operating costs. This pattern means online brands can post strong gross margins while operating margins tell a very different story. The spread between these two numbers quantifies that disconnect.
For scaling DTC brands, monitoring this gap is more actionable than watching either metric alone. Gross margin confirms pricing power and supplier economics are sound. Operating margin confirms whether the business can sustain growth without spending away its production profit. When the gap widens quarter over quarter, it pinpoints that the problem sits not in product economics but in the operational layer: rising acquisition costs, redundant SaaS subscriptions, or fulfillment inefficiencies eating into what looked like a healthy business on the gross profit line.
Treating the margin gap as a diagnostic metric, rather than just comparing two standalone ratios, gives operators a single signal for where to direct cost-reduction efforts next.
A good gross margin for ecommerce brands depends on the product vertical. Fashion and apparel brands typically target the highest margins, while food and beverage brands operate on thinner ones. The following subsections break down benchmarks for fashion, beauty, food, and home goods.
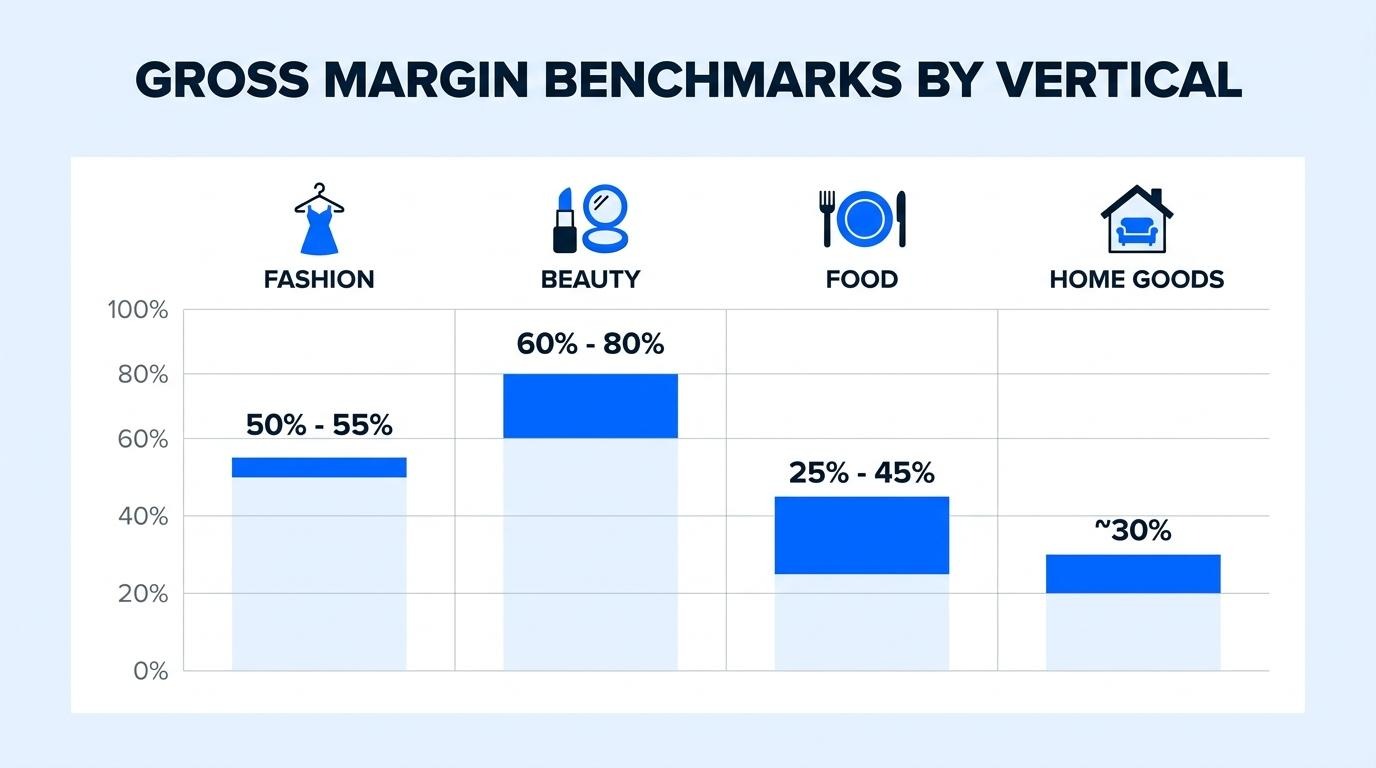
A good gross margin for fashion and apparel brands generally falls in the range of 50% or higher. According to the U.S. Census Bureau's 2022 Annual Retail Trade Survey, clothing and clothing accessories stores reported an estimated gross margin of 49.6% as a percentage of sales. DTC fashion brands that control their own manufacturing or sourcing often exceed this retail-industry average because they eliminate wholesale intermediary costs. Brands consistently below 45% should reassess supplier pricing, material costs, or product mix before scaling paid acquisition.
A good gross margin for beauty and skincare brands typically ranges from 60% to 80%. Formulation costs for skincare serums, cosmetics, and personal care products tend to be low relative to retail price, which creates some of the widest gross margins in ecommerce. Brands producing in-house or working with contract manufacturers on proprietary formulas sit at the higher end. Packaging, compliance testing, and ingredient sourcing are the primary COGS variables. For scaling DTC beauty brands, maintaining margins above 65% provides enough cushion to absorb rising customer acquisition and fulfillment costs without compressing operating profit.
A good gross margin for food and beverage brands typically falls between 25% and 45%. Raw ingredient costs, cold-chain logistics, shorter shelf life, and perishability all push COGS higher than in most other ecommerce verticals. Brands selling shelf-stable products like supplements, coffee, or snack foods tend to reach the upper end. Fresh or refrigerated products sit lower. Because gross margins are inherently tighter in this category, food and beverage brands must control operating expenses aggressively to preserve profitability at scale.
A good gross margin for home goods brands averages around 30%, though individual results vary widely by product type. According to Aswath Damodaran's NYU Stern sector dataset, the U.S. furniture and home furnishings sector reported a gross margin of 30.28% across 27 firms. Heavier items like furniture carry higher shipping and warehousing costs within COGS, while lighter decor or textile products can achieve margins closer to 40% or above. For brands in this vertical, even small improvements in supplier terms or packaging efficiency can meaningfully shift gross margin. Understanding where operating margin benchmarks fall helps contextualize whether that gross margin translates to real profitability.
A good operating margin for ecommerce brands typically falls between 5% and 15%, though the right target depends heavily on vertical. Fashion, beauty, food, and home goods each face different cost structures that shift what "good" looks like.
A good operating margin for fashion and apparel brands generally ranges from 4% to 13%. Apparel carries relatively high gross margins, but heavy spending on marketing, seasonal markdowns, and returns erodes profitability at the operating level. Brands investing aggressively in customer acquisition or managing high return rates often land in the lower single digits, while those with strong direct channels and controlled inventory tend to reach double digits. For scaling DTC apparel brands, consistently maintaining an operating margin above 10% signals disciplined cost management across fulfillment and advertising.
A good operating margin for beauty and skincare brands typically ranges from 8% to 15%. Beauty products carry some of the highest gross margins in ecommerce because raw material costs are low relative to selling price. The gap between gross and operating margin, however, narrows quickly once marketing spend, influencer partnerships, and subscription fulfillment costs are factored in. Brands with strong repeat-purchase rates retain more of that gross margin at the operating level. In practice, a beauty brand sustaining above 12% operating margin is leveraging retention well, not just acquisition.
A good operating margin for food and beverage brands typically ranges from 3% to 10%. This vertical faces the tightest margins in ecommerce due to perishability, cold-chain logistics, and lower average order values. Packaging and shipping costs consume a larger share of revenue than in most other categories. Subscription models help food brands stabilize revenue and improve margin predictability, but the underlying cost structure remains demanding. Any food and beverage brand consistently exceeding 7% operating margin is managing logistics and spoilage exceptionally well relative to peers.
A good operating margin for home goods brands typically ranges from 5% to 10%. According to NYU Stern's January 2026 sector data compiled by Aswath Damodaran, the U.S. furniture and home furnishings sector (27 firms) reported a gross margin of 30.28% and a pre-tax unadjusted operating margin of 6.59%. Heavy, bulky items drive up shipping and warehousing costs, which compresses the spread between gross and operating margin more than in lighter-product categories. Brands that localize inventory or offer flat-rate shipping strategies tend to protect more margin at the operating level.
Understanding where your vertical's margins should fall helps identify whether the real opportunity lies in cost structure improvements or revenue optimization.
A high gross margin paired with a low operating margin is caused by excessive operating expenses that consume the profit earned after production costs. A 2022 peer-reviewed study using European firm data from 2010–2019, published in Electronic Commerce Research, found that ecommerce firms have a different cost structure than traditional retail firms, with a lower share of labor costs and cost of goods sold but a higher share of other operating costs. The most common culprits for ecommerce brands are software and tool sprawl, rising customer acquisition costs, and manual fulfillment overhead.
App and tool sprawl erodes operating margin by stacking recurring subscription fees, integration maintenance costs, and training time across disconnected software. Each additional app adds a line item to SG&A that sits below gross profit. According to a 2025 OECD survey of platform-using SMEs, 40% of all SMEs cited maintenance costs as a key barrier to digitalization, followed by lack of training time at 39%.
The compounding effect is what makes this dangerous. Five or ten apps at modest monthly fees may seem manageable individually, but collectively they create a fixed-cost layer that scales with headcount and complexity rather than with revenue. Consolidating tools into fewer systems is one of the most direct ways to reclaim operating margin without touching product pricing.
Rising customer acquisition costs shrink operating margin by inflating the marketing and sales line items that sit between gross profit and operating income. Because CAC is classified as an operating expense, every dollar increase flows directly into the margin gap. As a 2024 peer-reviewed article in MIS Quarterly noted, Groupon reported a marketing expense of $336.9 million in its 2012 annual report, with 7.3 million consumers acquired worldwide, yielding an acquisition cost of $46 per new consumer globally. Acquisition costs have only climbed since, driven by platform privacy changes and ad auction competition.
The structural challenge is that CAC behaves as a variable cost that brands often treat as fixed. When acquisition spending rises faster than revenue, operating margin contracts even if gross margin holds steady.
Manual fulfillment overhead reduces operating margin by adding labor, error-correction, and warehousing costs that fall entirely within operating expenses. Picking, packing, shipping, and processing returns all require staffing and physical infrastructure. These costs do not appear in COGS for most ecommerce brands; they sit in SG&A or fulfillment line items below gross profit.
As order volume grows, manual processes scale linearly with headcount rather than with efficiency. Brands that delay automation or warehouse optimization often see their operating margin decline even as gross margin stays flat, because each incremental order costs nearly as much to fulfill as the last.
Understanding these operating-cost pressures helps clarify when to prioritize gross margin improvements versus operating margin fixes.
You should focus on gross margin when evaluating product-level profitability and on operating margin when assessing overall business efficiency. The sections below clarify when each metric deserves priority.
Gross margin is the more important metric to watch when you need to evaluate whether your products generate enough profit before overhead enters the picture. This applies during several specific situations:
For scaling DTC brands, gross margin is the leading indicator of pricing power. If it erodes, no amount of operational efficiency downstream can compensate.
You should prioritize improving operating margin when your gross margin is stable but profitability remains weak, signaling that overhead costs are consuming the spread. Key scenarios include:
Operating margin is where operational discipline becomes visible. A healthy gross margin paired with a thin operating margin often points to tool sprawl, manual processes, or inefficient spend allocation rather than a product problem.
With these decision points clear, the next step is identifying specific tactics to improve each margin.
DTC brands can improve gross margin by reducing cost of goods sold relative to revenue. The most effective levers include renegotiating supplier terms, optimizing product mix, and lowering direct production costs.
According to a 2022 peer-reviewed study published in Electronic Commerce Research, e-commerce firms carry a different cost structure than traditional retailers, with a lower share of cost of goods sold but a higher share of other operating costs. This makes gross margin improvement especially valuable for DTC brands, since the savings flow straight into covering those elevated operating expenses. For most scaling brands, supplier renegotiation and SKU rationalization deliver the fastest gross margin gains before any operational changes are needed.
Understanding where gross margin stands also clarifies how much room exists to absorb rising operating costs, which is where operating margin improvement strategies come in.
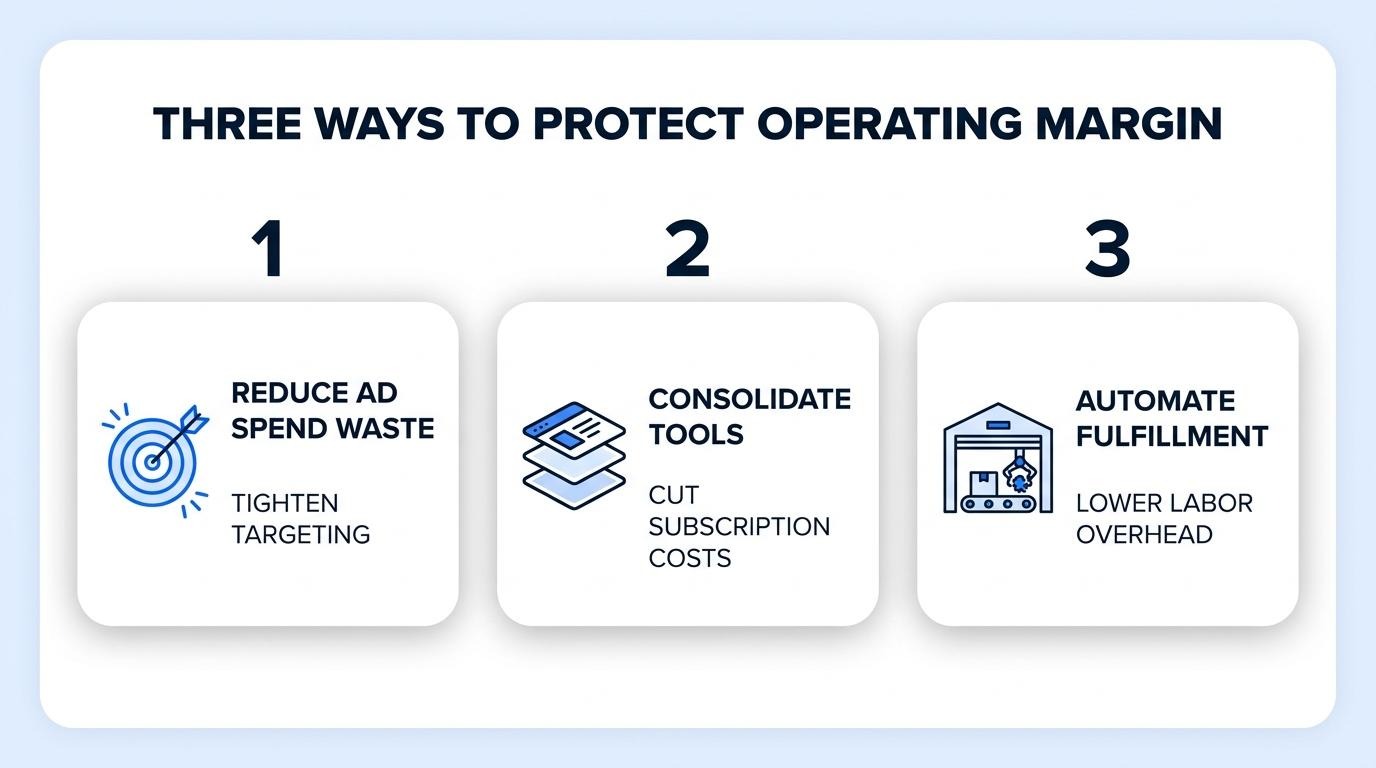
DTC brands can improve operating margin by reducing operating expenses that sit between gross profit and operating income. The most effective levers target advertising efficiency, fulfillment costs, and software overhead.
For brands running five or more disconnected tools across their storefront, email, subscriptions, and CRM, consolidating onto a single platform is often the fastest path to measurable operating margin gains. Each eliminated integration removes a license fee, a maintenance burden, and a failure point. Understanding how these margin layers connect to net profitability completes the full financial picture.
The relationship between profit margins and net margin is hierarchical: gross margin measures production profitability, operating margin measures operational profitability, and net margin measures final profitability after all expenses, taxes, and interest. Each level subtracts additional costs from revenue.
Gross margin captures only the cost of goods sold. Operating margin subtracts operating expenses from gross profit. Net margin then deducts interest payments, taxes, and any non-operating gains or losses. A brand can hold a strong gross margin yet report a thin net margin if debt service or tax obligations consume the remaining profit.
This cascading structure means that improving any upstream margin directly influences the downstream result. A 2023 peer-reviewed study published in Heliyon defines customer lifetime value as the present value of all profits created by customers throughout their relationship with an enterprise. That definition underscores why net margin, not gross margin alone, determines how much long-term value each customer actually generates.
For scaling DTC brands, monitoring all three tiers together reveals where profit leaks occur. Gross margin isolates sourcing and production efficiency. Operating margin exposes overhead bloat from tools, labor, and acquisition costs. Net margin confirms whether the business truly earns money after financing and taxes are settled. Treating these metrics as a connected system, rather than isolated ratios, gives operators the clearest picture of financial health and growth sustainability.
Margins change as an ecommerce brand scales because growth shifts the balance between volume-driven cost savings and rising operational complexity. Gross margins tend to stabilize or improve with purchasing leverage, while operating margins face pressure from fulfillment, labor, and software costs before eventually benefiting from economies of scale.
Early-stage brands typically absorb high per-unit costs across production, shipping, and customer acquisition. As order volume increases, unit economics improve on the gross margin line through better supplier pricing and lower per-item freight. However, operating margin often compresses before it expands; warehousing, headcount, and marketing infrastructure require upfront investment that outpaces revenue gains at intermediate growth stages.
A 2023 peer-reviewed study published in Econometrica, examining Amazon's fulfillment center network from 1999 to 2018, found that network expansion led to significant shipping cost savings and facilitated the realization of aggregate economies of scale. While Amazon's infrastructure dwarfs most DTC operations, the underlying principle holds: density and volume reduce per-order fulfillment costs over time.
The real margin inflection for most scaling brands occurs when fixed operating costs (warehouse leases, platform subscriptions, core team salaries) spread across enough orders that per-unit operating expense declines faster than new costs accumulate. Brands that reach this point with a lean tech stack and efficient fulfillment operations tend to see operating margin recover and eventually expand alongside gross margin.
For brands navigating the $1M to $10M range, the gap between gross margin and operating margin often widens before it narrows. Recognizing this pattern helps operators set realistic profitability timelines and invest in infrastructure that pays off at the next revenue tier rather than optimizing prematurely for short-term margin gains.
Understanding how margins shift at scale provides context for evaluating whether tool consolidation can accelerate the path to operating leverage.
Reducing tool sprawl protects margins by consolidating software costs, eliminating data silos, and lowering the operational overhead that erodes operating margin. The subsections below cover what changes when commerce, CRM, and marketing share one system, followed by key takeaways on gross margin vs. operating margin.
What changes when commerce, CRM, and marketing live in one system is the elimination of redundant subscription fees, disconnected data, and manual workarounds that inflate operating expenses without touching COGS. Software, marketing tools, and CRM platforms all sit within the operating expense layer; consolidating them reduces the line items that widen the gap between gross margin and operating margin.
A 2025 peer-reviewed study published in INFORMS Management Science found that conversion-optimized Meta advertisements saw a 37% reduction in click-through rates after Apple's App Tracking Transparency rollout. When acquisition channels lose efficiency, first-party customer data housed in a unified system becomes essential for maintaining ad performance without spiraling spend.
For brands running real volume, platforms that unify storefront, lifecycle marketing, and CRM into a single customer record, such as SHOPLINE, remove the sync tax that fragmented stacks impose at scale.
The key takeaways about gross margin vs. operating margin are: