Contribution margin is the revenue remaining after subtracting all variable costs from a sale, while gross margin is the percentage of revenue left after subtracting the cost of goods sold (COGS). Both measure profitability, but each captures a different cost layer.
This guide covers how each margin is defined and calculated, which costs each metric includes and excludes, when to use one over the other, how they behave across industries, and the common mistakes that distort both.
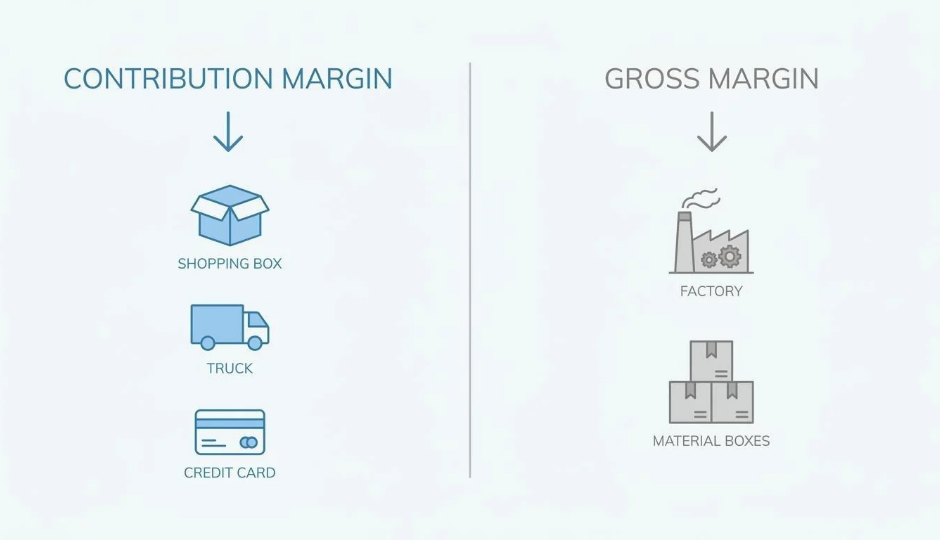
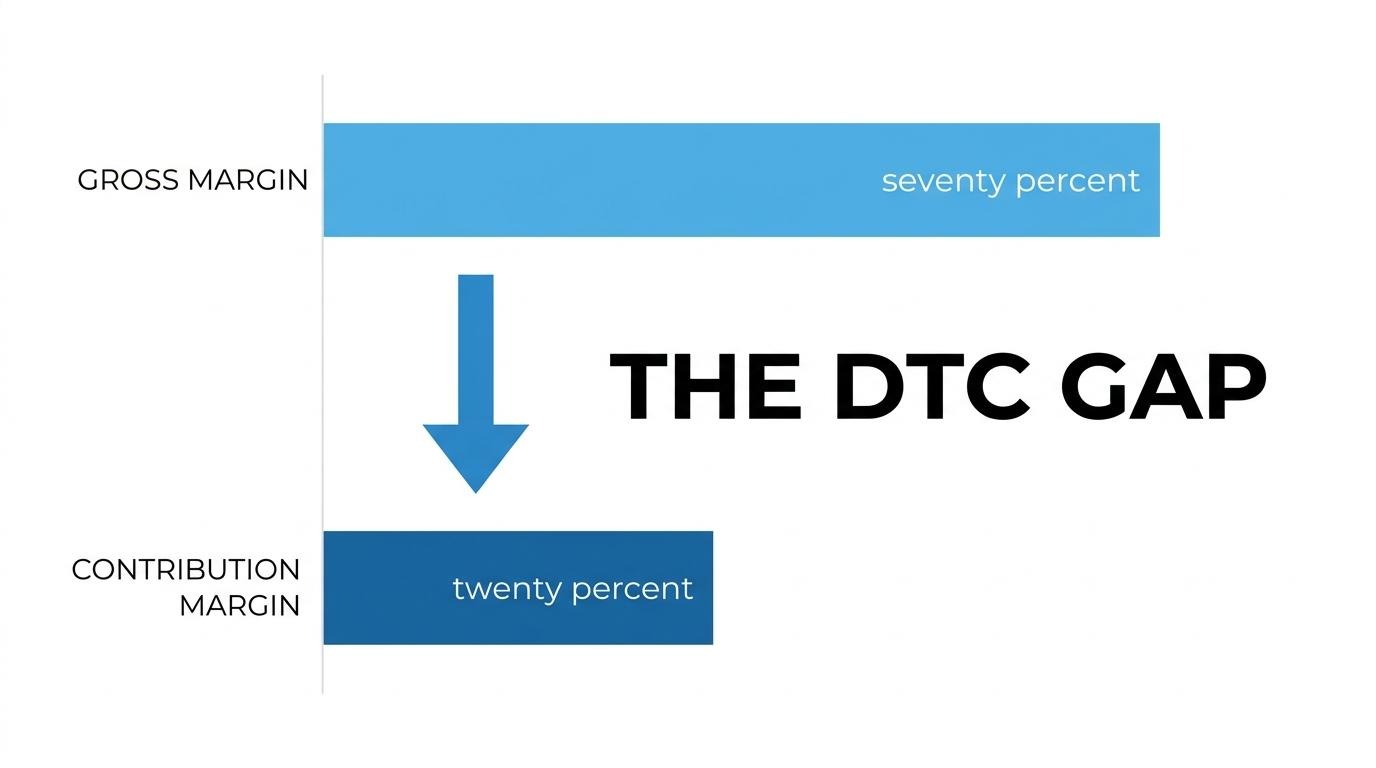
Contribution margin subtracts every variable expense tied to a single order, including shipping, payment processing, customer acquisition, and returns. Gross margin follows accounting standards and focuses on production-level costs like materials, direct labor, and factory overhead. That structural difference explains why a product can show a 70 percent gross margin yet carry a contribution margin below 20 percent once per-order selling costs are factored in.
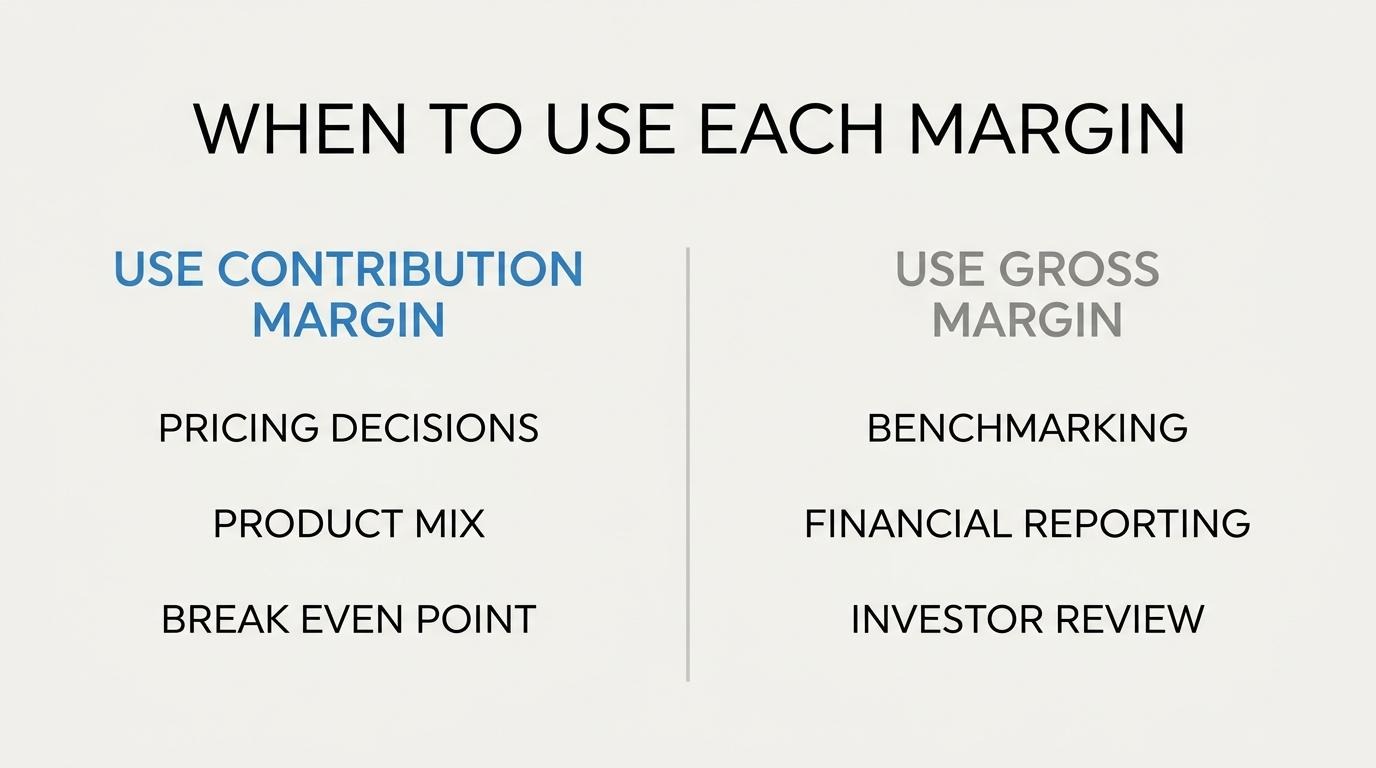
Choosing the right metric depends on the decision at hand. Contribution margin is the sharper tool for pricing, product mix optimization, and break-even analysis because it isolates variable cost behavior at the unit level. Gross margin is better suited for cross-company benchmarking and financial reporting, since COGS is a standardized line item that investors and lenders expect to see.
Benchmarks vary widely by sector. Software businesses often see contribution margin ratios between 70 and 90 percent, while retail typically falls between 20 and 40 percent. For DTC brands, the gap between gross and contribution margin is where fulfillment, acquisition, and return costs quietly erode profitability.
Accurate cost classification is the foundation of both metrics. Misplacing even one line item between variable and fixed distorts unit economics and compounds across thousands of orders.
Contribution margin is the amount of revenue remaining after subtracting all variable costs from sales. It represents the portion of each sale available to cover fixed costs and generate profit. As one of the key building blocks of break-even analysis, contribution margin is computed as the selling price per unit minus the variable cost per unit, according to Wikipedia.
Variable costs included in this calculation go beyond production expenses. They encompass costs that fluctuate with each sale, such as shipping, payment processing fees, sales commissions, and packaging. Because these costs scale directly with order volume, contribution margin reveals how much each individual transaction actually contributes to the bottom line.
For ecommerce operators, this metric is particularly telling. A product may look profitable based on its sticker price and production cost alone, yet once per-order variable expenses are factored in, the real margin can be significantly lower. Understanding contribution margin at the unit level helps brands make sharper decisions about pricing, promotions, and which products deserve more investment.
Gross margin is the percentage of revenue remaining after subtracting the cost of goods sold (COGS). It measures how efficiently a business produces or sources its products before accounting for operating expenses, marketing costs, or overhead. Calculated as (Revenue - COGS) ÷ Revenue × 100, gross margin isolates production-level profitability from the rest of the income statement.
Unlike contribution margin, which separates costs based on economic behavior (variable vs. fixed), gross margin is determined using accounting standards. This distinction matters because COGS can include both variable and fixed production costs, such as direct materials, direct labor, and factory overhead allocated to units sold. According to a KPMG report on income statement presentation, IFRS does not define gross profit or many other common subtotals, which gives preparers flexibility in how they classify and report these figures.
For ecommerce and DTC brands, gross margin serves as the first checkpoint for product viability. A product with weak gross margin rarely becomes profitable downstream, regardless of how well other costs are managed. Understanding this metric sets the stage for comparing it against contribution margin in the sections ahead.
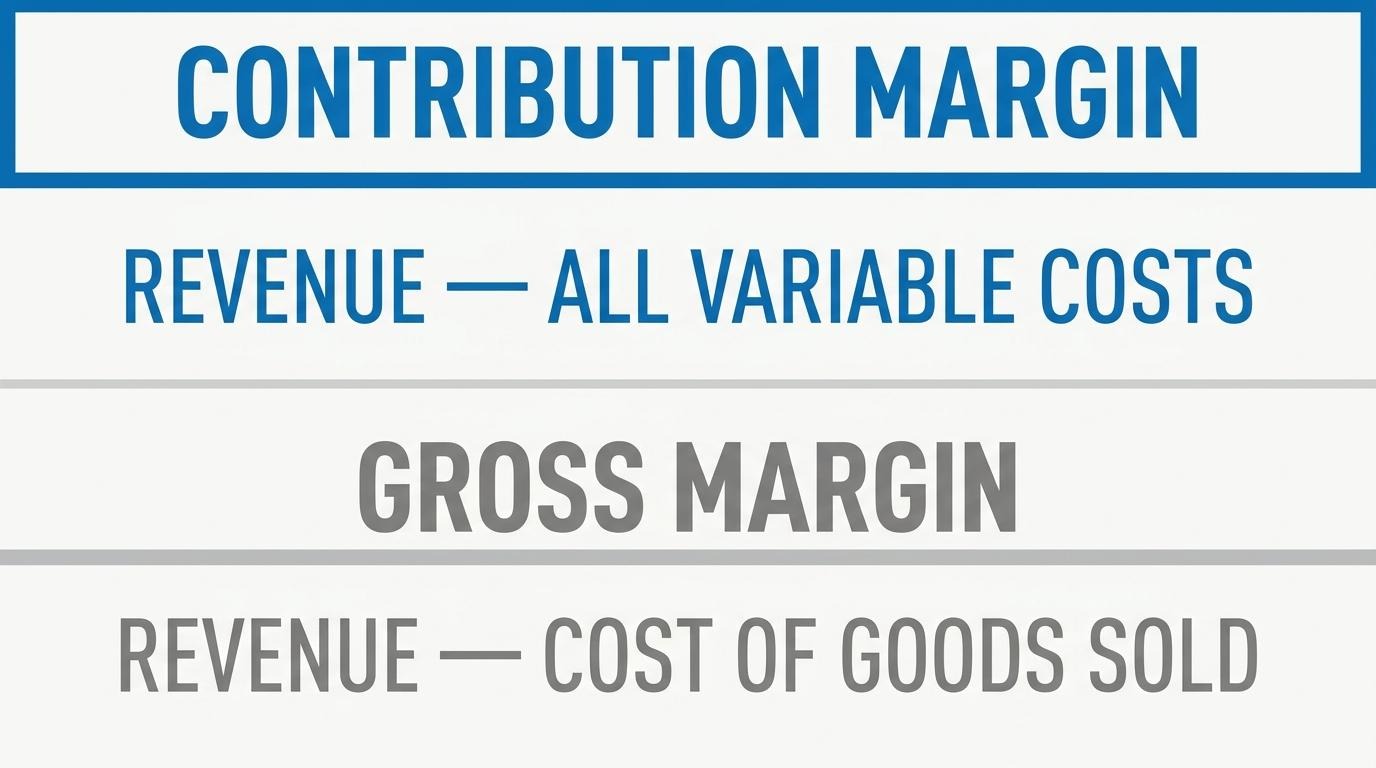
You calculate contribution margin by subtracting variable costs from revenue, and gross margin by subtracting COGS from revenue. Each formula isolates a different cost layer.
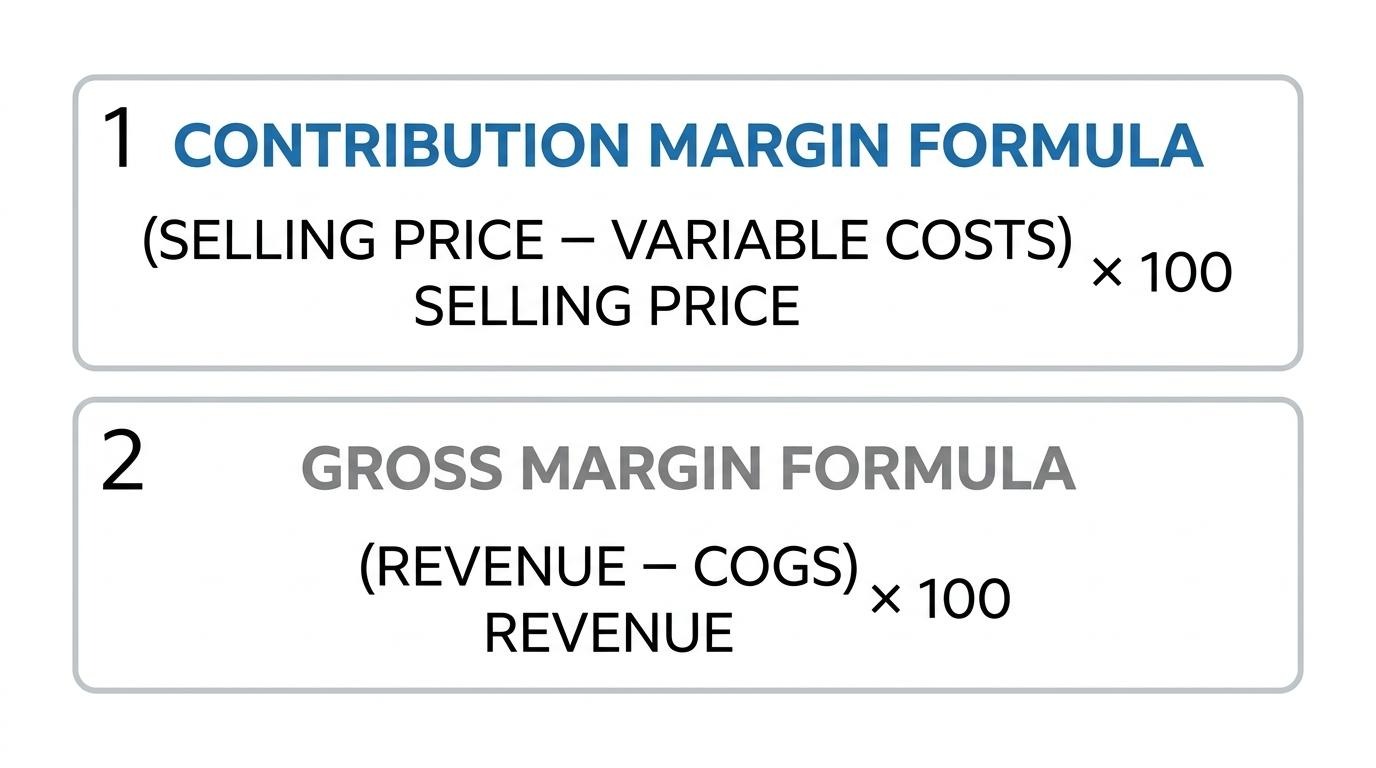
You calculate contribution margin by subtracting all variable costs per unit from the selling price per unit. The formula is:
Contribution Margin = Selling Price per Unit − Variable Cost per Unit
To express it as a ratio, divide the result by the selling price:
Contribution Margin Ratio = (Selling Price − Variable Costs) ÷ Selling Price × 100
Variable costs in this formula include materials, direct labor, shipping, payment processing fees, and sales commissions. According to Wikipedia, the contribution margin is one of the key building blocks of break-even analysis, connecting per-unit profitability directly to fixed cost coverage. Getting this calculation right depends entirely on correctly classifying which costs are truly variable; misclassification is where most errors originate.
You calculate gross margin by subtracting the cost of goods sold from total revenue, then dividing by revenue. The formula is:
Gross Margin = (Revenue − COGS) ÷ Revenue × 100
COGS typically includes direct production costs, raw materials, manufacturing labor, and packaging. Unlike contribution margin, gross margin follows accounting standards and appears on formal income statements, which makes it the metric investors and lenders examine first. One important distinction: gross margin excludes variable selling expenses like shipping and transaction fees, so it will almost always appear higher than contribution margin for the same product. For operators making day-to-day decisions, that gap between the two numbers is where real profitability insight lives.
Understanding both formulas clarifies which costs each metric captures and which it ignores.
Each margin captures a different slice of your cost structure. The subsections below break down which variable costs feed contribution margin, which costs gross margin includes that contribution margin does not, and how fixed costs are treated differently in each calculation.
The variable costs included in contribution margin are all expenses that rise or fall in direct proportion to units sold. These typically include:
Accurate classification is critical. According to Accounovation, the most common mistake in contribution margin analysis is misclassifying costs, treating expenses as fixed when they are actually variable, or vice versa. Even one misplaced line item distorts per-unit profitability and can quietly erode pricing decisions over time.
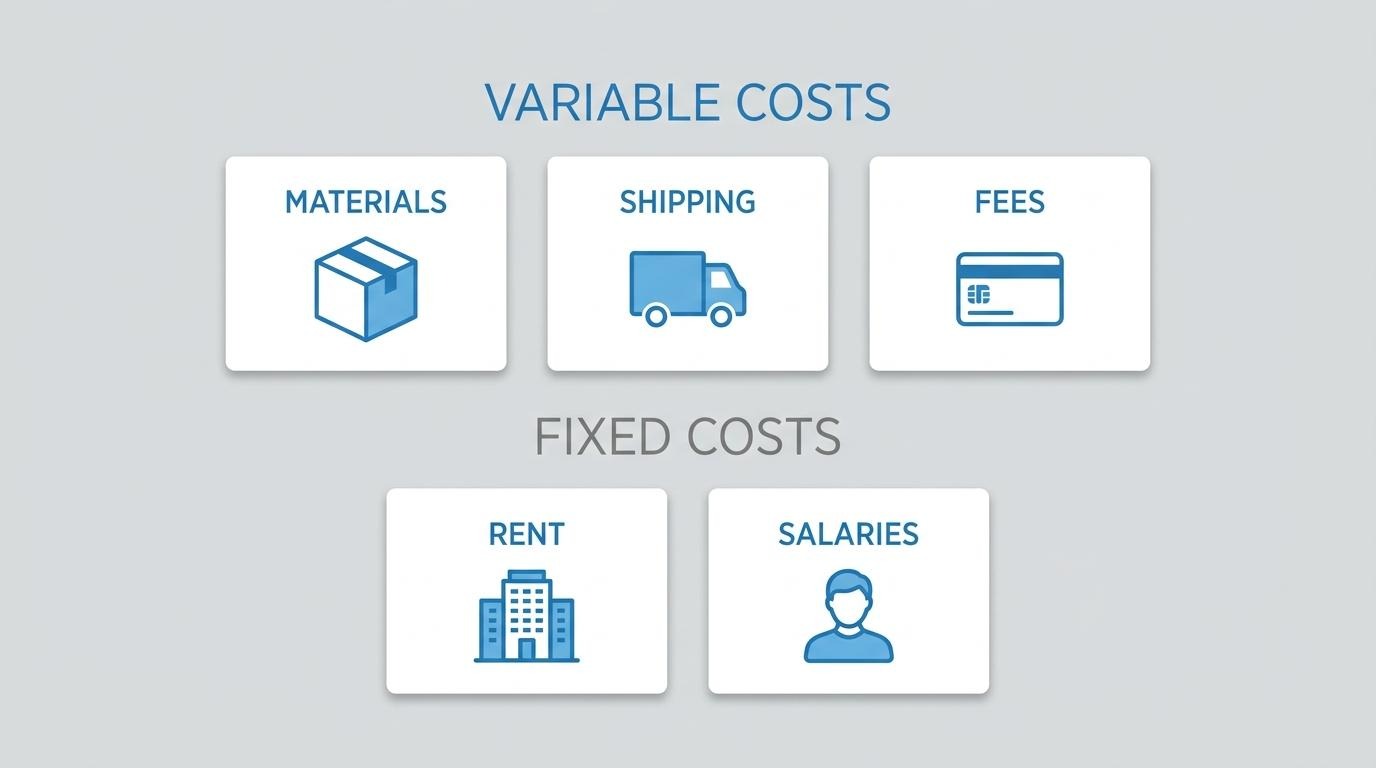
The costs included in gross margin but not contribution margin are fixed production costs that COGS absorbs regardless of sales volume. Gross margin captures expenses like factory rent, equipment depreciation, salaried production labor, and warehouse overhead. These costs exist whether you sell one unit or ten thousand.
Contribution margin, by contrast, strips those out and focuses only on variable costs. As Wikipedia notes, contribution margin separates variable costs from fixed costs on the basis of economic analysis, while gross margin is determined using accounting standards.
This gap explains why the two numbers can diverge dramatically. According to Luca, a typical $50 DTC skincare product carries a 70 percent gross margin that shrinks to just 19.5 percent contribution margin after subtracting shipping, attributed CAC, returns allocation, payment processing, and platform fees. For most DTC operators, gross margin alone paints an incomplete picture of true per-order economics.
Fixed costs are treated differently because each margin serves a distinct analytical purpose. Gross margin partially absorbs fixed costs through COGS; fixed manufacturing overhead, equipment depreciation, and salaried factory labor all get allocated into cost of goods sold under standard accounting rules. This means gross margin reflects some fixed cost burden, though it does not separate it visibly.
Contribution margin excludes fixed costs entirely. It isolates only what changes with each sale, leaving fixed expenses like rent, salaries, insurance, and software subscriptions to be covered by the total contribution pool. This clean separation is what makes contribution margin essential for break-even analysis and per-unit decision-making.
Understanding how each margin handles fixed costs reveals where profitability actually lives, and which lever to pull when margins tighten.
The distinction between variable and fixed costs matters because it determines which margin metric delivers accurate insight for a given decision. Misclassifying costs distorts both contribution margin and gross margin, leading to flawed pricing, inaccurate break-even targets, and misleading profitability reports.
Variable costs change with each unit sold, including materials, shipping, payment processing, and sales commissions. Fixed costs remain constant regardless of volume, such as rent, salaried labor, and software subscriptions. When a cost is placed in the wrong category, the resulting margin calculation misrepresents unit economics. According to Accounovation, the most common mistake in contribution margin analysis is misclassifying costs, treating expenses as fixed when they are actually variable and vice versa.
This classification shapes which metric to use. Contribution margin isolates variable costs to reveal per-unit profitability, making it essential for pricing, product mix, and break-even decisions. Gross margin groups costs by accounting standards (COGS), which blends some fixed production costs with variable ones. A product can show a healthy gross margin while its contribution margin tells a different story once all variable expenses are accounted for.
For scaling DTC brands running complex operations, getting this distinction right is not optional. Every discount, shipping policy, and channel expansion decision compounds across thousands of orders. Understanding which costs flex with volume and which stay fixed separates brands that scale profitably from those that grow into margin erosion.
You should use contribution margin instead of gross margin when decisions depend on variable cost behavior at the unit level. The subsections below cover pricing, product mix, and break-even analysis.
Contribution margin is more useful for pricing decisions when you need to understand how each unit sold covers variable costs before contributing to fixed expenses. Gross margin lumps some fixed production costs into COGS, which obscures the per-unit economics that drive pricing strategy. Contribution margin isolates only variable costs, such as materials, shipping, and payment processing, so you can see the true incremental profit each sale generates. This clarity matters most when testing price points, evaluating promotional offers, or deciding whether a lower-margin product still justifies its shelf space. For scaling DTC brands juggling fulfillment fees and ad spend, contribution margin reveals pricing floors that gross margin alone cannot.
Contribution margin helps with product mix decisions by showing which products generate the most incremental profit per unit after variable costs. When catalog breadth grows, some SKUs appear profitable on a gross margin basis yet barely cover their variable expenses. Contribution margin exposes these underperformers. It also quantifies the true cost of discounting: according to Accounovation, a 10 percent discount on a product with a 40 percent contribution margin reduces the profit margin by 25 percent. That kind of erosion is invisible if you only track gross margin. Ranking SKUs by contribution margin per unit helps operators allocate marketing spend, warehouse space, and inventory investment toward the products that actually drive profitability.
Contribution margin is better for break-even analysis because it directly measures how much each unit sold contributes toward covering fixed costs. As Wikipedia notes, the contribution margin is computed as the selling price per unit minus the variable cost per unit and is one of the key building blocks of break-even analysis. Dividing total fixed costs by the contribution margin per unit yields the exact number of units needed to break even. Gross margin cannot perform this calculation cleanly because it blends fixed and variable production costs into a single figure. For any operator modeling new product launches or evaluating whether a sales channel is viable, contribution margin provides the precision that break-even math requires.
Understanding when contribution margin is the right tool sets the stage for recognizing where gross margin fits better.
Gross margin is the better choice when you need standardized profitability comparisons or formal financial reporting. The following subsections cover cross-company benchmarking and compliance-driven reporting.
Gross margin is better for comparing profitability across companies because it relies on a standardized cost category: cost of goods sold. Every public company reports COGS on its income statement, which makes gross margin directly comparable across competitors, industries, and time periods.
Contribution margin, by contrast, depends on each company's internal classification of variable versus fixed costs. Those classifications vary widely and are rarely disclosed externally. When evaluating acquisition targets, benchmarking against peers, or screening investment opportunities, gross margin provides the consistent baseline that contribution margin cannot. For any cross-company analysis, gross margin should be the default metric.
Gross margin works better for financial reporting because accounting standards structure income statements around cost of goods sold, not variable cost classifications. Gross profit appears as a standard line item on income statements prepared under both U.S. GAAP and IFRS frameworks.
According to a KPMG analysis of income statement presentation, IFRS preparers have flexibility in selecting their income statement format, and IFRS does not define gross profit or many other common subtotals. Despite this flexibility, gross profit remains a universally recognized subtotal that auditors, investors, and lenders expect to see. Contribution margin, because it requires internal cost behavior analysis, has no standardized place in external financial statements.
For brands preparing for investor due diligence or bank financing, gross margin is the metric that external stakeholders will scrutinize first.
Contribution margin and gross margin differ by industry because each sector carries a distinct mix of variable costs, fixed overhead, and cost-of-goods structures. According to Vena Solutions, the average gross profit margin across all industries is 36.56 percent. The subsections below break down how these margins behave for ecommerce and DTC brands, manufacturing businesses, and service-based businesses.
They differ for ecommerce and DTC brands primarily in how variable selling costs erode contribution margin well below gross margin. Strong DTC brands often target gross margins above 60 percent, since COGS for sourced or manufactured goods can be relatively low. However, once variable costs like shipping, payment processing, customer acquisition, and returns are subtracted, contribution margins typically land between 15 and 30 percent. That gap makes gross margin alone a misleading health indicator for online brands. For operators scaling past seven figures, tracking both margins at the order level reveals where fulfillment and acquisition costs quietly consume profitability.
They differ for manufacturing businesses because a larger share of total costs sits inside COGS, which narrows the gap between the two margins. Raw materials, direct labor, and production overhead drive gross margin lower than in asset-light models. Variable costs outside COGS, such as sales commissions or freight, exist but represent a smaller proportion of revenue. As a result, contribution margin and gross margin tend to converge more closely in manufacturing than in ecommerce. The real analytical value for manufacturers lies in using contribution margin to evaluate individual product lines sharing the same production capacity.
They differ for service-based businesses because labor is often the dominant cost, and its classification determines how each margin behaves. Gross margin in service firms reflects direct labor and delivery costs, which can be high relative to revenue. Variable costs beyond COGS, such as project-specific software subscriptions or contractor fees, are typically modest. This means contribution margins in service businesses often track closer to gross margins than they do in product-based industries. The critical distinction is whether labor hours scale linearly with each new client engagement; when they do, contribution margin analysis becomes essential for pricing each project profitably.
Understanding industry-specific margin behavior sets the stage for defining what "good" looks like across different benchmarks.
A good contribution margin ratio and a good gross margin ratio depend entirely on industry, business model, and cost structure. Neither metric has a single universal benchmark.
According to Xero, software businesses typically see contribution margin ratios between 70 and 90 percent, while retail ranges from 20 to 40 percent. These wide gaps reflect how variable cost intensity differs across sectors. A SaaS company carries minimal per-unit variable costs after development, so most revenue flows toward covering fixed costs. Retail businesses, by contrast, absorb materials, freight, and transaction fees on every sale.
Gross margin benchmarks follow a similar pattern. Strong DTC brands generally target gross margins above 50 percent, with anything below 45 percent raising concern. Service businesses often exceed 60 percent because they carry little or no cost of goods sold.
The contribution margin ratio also serves a direct operational function: dividing total fixed costs by this ratio reveals the break-even point in sales dollars. A higher ratio means fewer dollars needed to cover overhead, which gives a business more room to absorb demand fluctuations or invest in growth.
For scaling ecommerce brands, focusing solely on gross margin creates a blind spot. Variable costs like shipping, payment processing, and customer acquisition can compress a seemingly healthy gross margin into a thin contribution margin. Tracking both ratios together reveals whether unit economics actually support profitable growth at scale.
These margins affect ecommerce pricing and profitability by revealing different layers of cost exposure. Contribution margin exposes per-order variable costs, gross margin guides product line health, and shipping and fulfillment costs erode both.
Contribution margin guides per-order profitability by isolating every variable cost attached to a single transaction. After subtracting shipping, payment processing, customer acquisition cost, and returns allocation from revenue, the remaining figure shows whether each order actually generates profit.
This per-order lens is especially critical for DTC brands running paid acquisition. A product with strong gross margins can still lose money on every sale once variable costs stack up. Tracking contribution margin at the order level reveals which promotions, channels, and SKUs truly earn their keep. For operators scaling past seven figures, this granularity separates sustainable growth from revenue that quietly bleeds cash.
Gross margin shapes overall product line strategy by measuring how efficiently a brand produces or sources its catalog. Because gross margin captures COGS without layering in per-order variable expenses, it highlights which product lines carry the strongest built-in profitability before marketing or fulfillment enter the picture.
Brands use this view to decide where to invest. A product line holding 65 percent gross margin can absorb heavier promotional spending, while one hovering near 45 percent leaves little room for error. When evaluating whether to expand a category, introduce a new SKU, or discontinue a line, gross margin acts as the first filter. Contribution margin then pressure-tests those decisions against real-world selling costs.
Shipping and fulfillment costs impact each margin differently. Gross margin typically excludes outbound shipping, so it remains unaffected by delivery expenses. Contribution margin, however, absorbs these costs directly, often dramatically.
According to Luca, a typical $50 DTC skincare product with a 70 percent gross margin shrinks to just 19.5 percent contribution margin after subtracting shipping, attributed CAC, returns allocation, payment processing, and platform fees. Outbound shipping alone runs $5 to $12 per order depending on weight, dimensions, and zone. For heavy or bulky products, that cost can consume 15 to 25 percent of the product price. This gap between gross and contribution margin is where many ecommerce brands discover their real profitability picture.
Understanding this fulfillment impact helps brands set pricing floors that protect actual margins, not just paper ones.
Brands commonly make mistakes such as misclassifying costs, ignoring discount impacts on contribution margin, and calculating COGS too infrequently. These errors distort both gross margin and contribution margin, leading to flawed pricing and profitability assumptions.
The most frequent mistakes include:
For scaling DTC brands, the fix is straightforward: audit cost classifications quarterly, model discount scenarios against contribution margin before launching promotions, and update COGS monthly rather than annually. Getting these fundamentals right is what separates brands that scale profitably from those that grow into deeper losses.
With accurate margin data in hand, the next step is ensuring that data lives in a system where it stays connected.
Tracking both margins changes significantly when your data lives in one system: variable costs, COGS, and revenue feed from a single source, eliminating manual reconciliation. Below, see how SHOPLINE approaches this and the key takeaways from this guide.
SHOPLINE’s profit margin reports help merchants review gross profit and gross margin for products with recorded costs. To calculate contribution margin, merchants also need to account for variable expenses such as shipping, payment processing, and customer acquisition using the relevant cost data.
This matters for margin tracking because contribution margin depends on accurate, order-level variable cost data. When acquisition costs live in one tool, fulfillment data in another, and returns in a third, the reconciliation gaps quietly inflate reported margins. SHOPLINE consolidates these inputs natively, so brands operating at scale can monitor both gross margin and contribution margin from the same dashboard without manual stitching.
The key takeaways about contribution margin vs. gross margin center on what each metric reveals and when to use it:
For scaling DTC brands, relying on gross margin alone can mask the true cost of fulfilling and acquiring each order. Tracking both margins together, ideally from a unified data source, produces the clearest view of where profit actually lands.