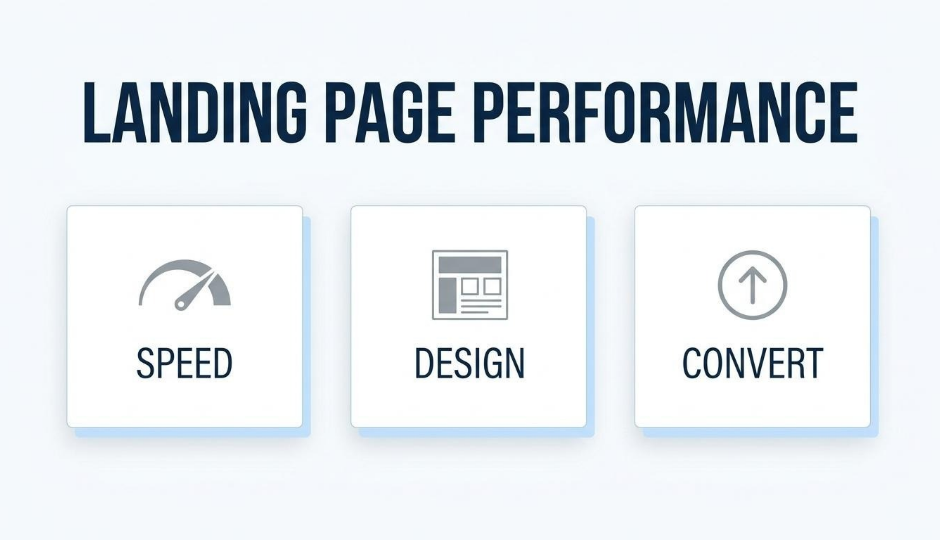
Landing page performance is the measure of how effectively a page converts visitors into leads or customers, determined by load speed, design clarity, copy relevance, and trust elements working together.
This guide covers page fundamentals and speed optimization, headline and visual design strategy, CTA and form optimization, A/B testing and audience segmentation, and trust signals paired with unified customer data.
Fast load times form the foundation of every high-converting page. Sites loading in one second convert at multiple times the rate of slower pages, and each additional second of delay erodes conversions measurably. Mobile responsiveness compounds this; over half of all web traffic arrives on mobile devices, yet mobile converts at roughly half the desktop rate.
Headline structure and visual hierarchy determine whether visitors stay long enough to act. Scannable copy, benefit-driven headlines, and strategic whitespace guide attention toward the conversion point rather than letting visitors bounce.
CTA placement, color contrast, and action-oriented copy each influence click-through rates independently. Form length matters equally; every unnecessary field reduces submissions, while inline validation and progressive profiling recover completions that would otherwise be lost.
Systematic A/B testing isolates which changes actually lift conversions, and audience segmentation ensures the right message reaches the right visitor. Personalized landing pages consistently outperform generic versions across traffic sources and visitor types.
Trust signals like reviews, testimonials, and security badges reduce buyer hesitation at decision points. When these elements connect to unified customer data within a single platform like SHOPLINE, personalization becomes immediate rather than fragmented across disconnected tools.
A high-performing landing page combines core structural elements, fast load times, and mobile responsiveness to convert visitors consistently. The sections below cover essential page components, speed benchmarks, and responsive design requirements.
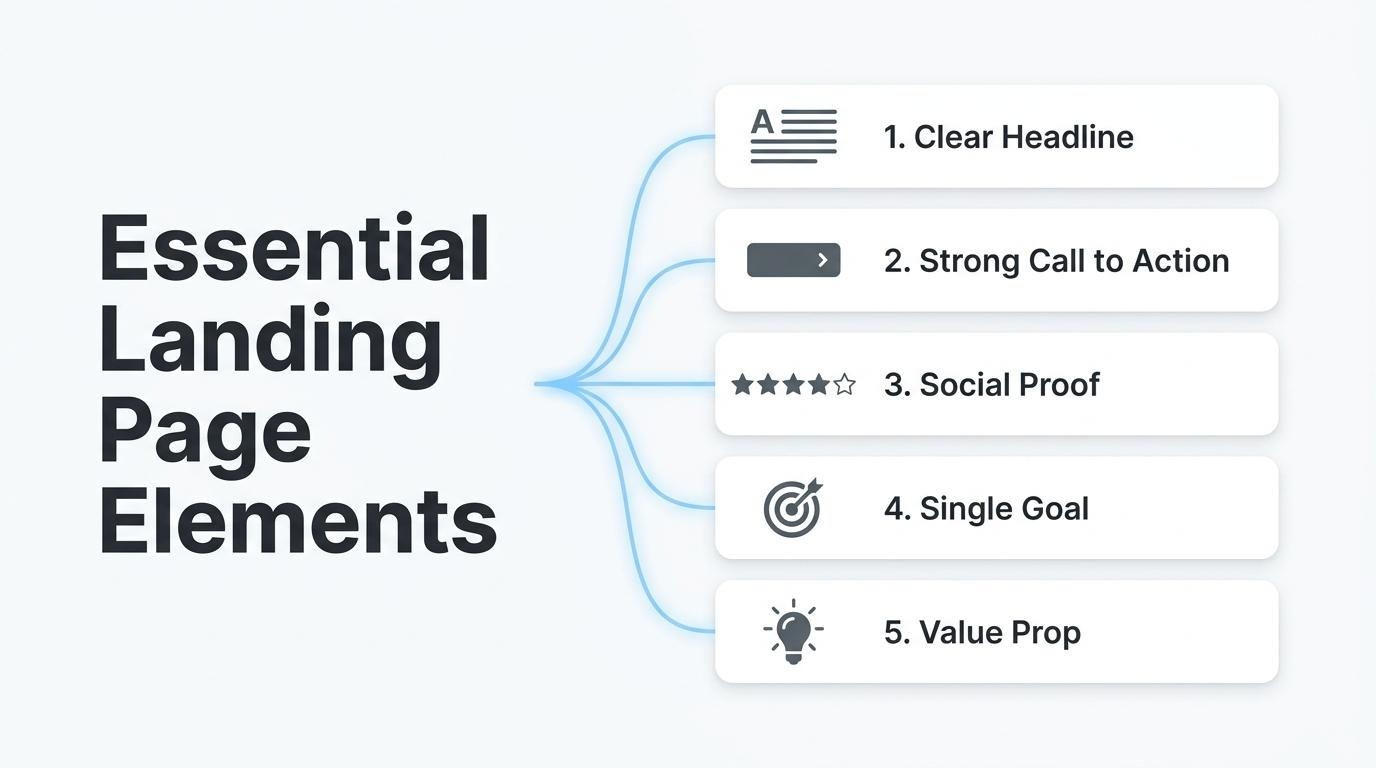
Every landing page needs a clear headline, a focused call to action, supporting social proof, and a single conversion goal. These elements work together to guide visitors toward one specific action without distraction.
The essential components include:
Each element should be tested independently against a control. According to Mida, a page converting at 2–5% typically needs 1,000–2,000 conversions per variant to detect a 10–20% relative lift with 95% confidence. Without that volume, test results remain unreliable.
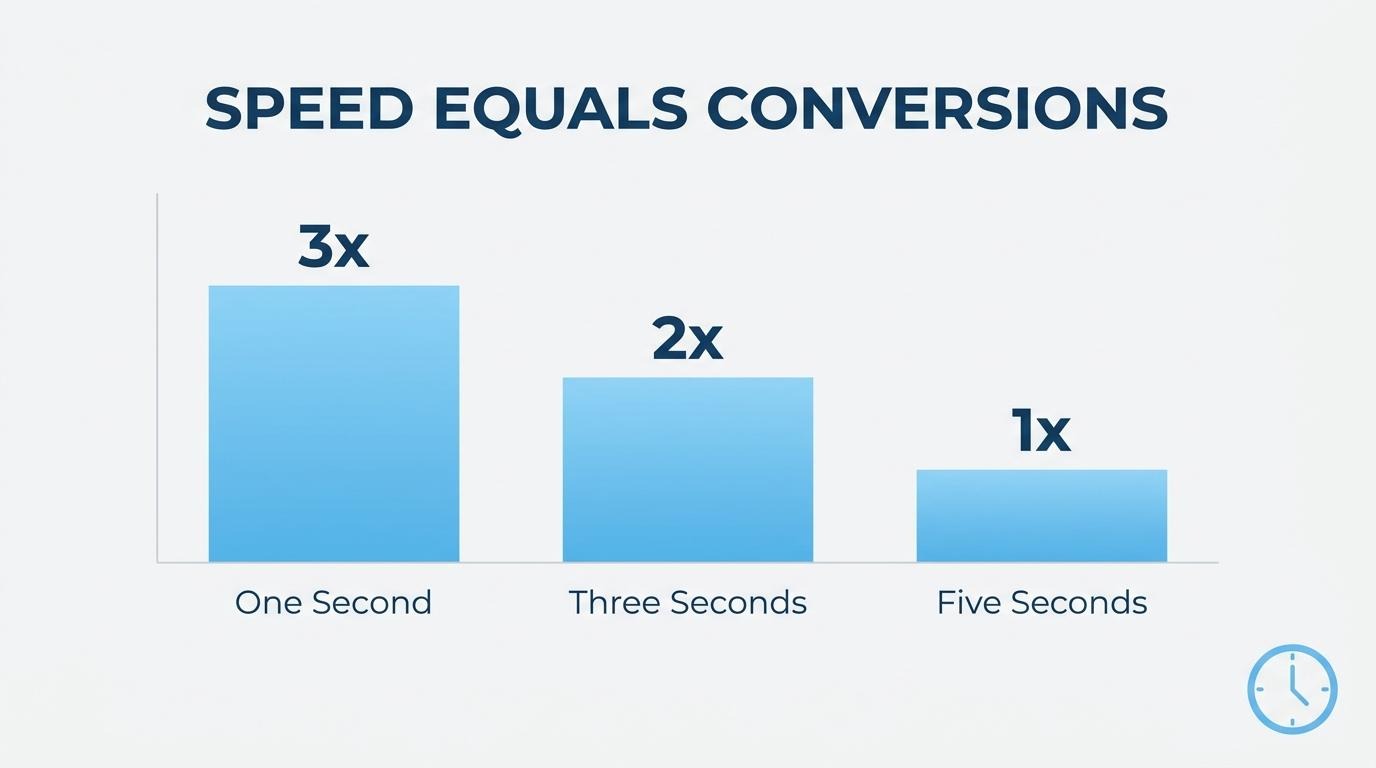
Page load speed directly determines how many visitors stay long enough to convert. According to Portent's research, a site loading in 1 second achieves a conversion rate 3x higher than one loading in 5 seconds for B2B lead generation, and 2.5x higher for e-commerce.
The degradation is steep: e-commerce conversion rates drop by an average of 0.3% for every additional second of load time. Google Search Central recommends keeping Largest Contentful Paint under 2.5 seconds to meet Core Web Vitals thresholds.
For brands running paid campaigns, every fraction of a second compounds lost revenue. Speed is the one variable that affects every visitor equally, regardless of copy quality or design.
Mobile responsiveness matters for landing pages because the majority of traffic now arrives on smaller screens. In Q2 2026, mobile devices accounted for 51.48% of global website traffic, according to Statista. Despite this volume, mobile converts at roughly half the desktop rate; brands that treat mobile as an afterthought lose conversions on their highest-traffic channel.
Responsive design requires more than fluid layouts. Touch targets, form field sizing, and CTA visibility all need separate consideration on mobile. The marking scanning pattern, where users keep their eyes fixed as pages scroll, occurs more frequently on mobile, making above-the-fold content placement even more critical for smaller screens.
Landing page performance is defined by how effectively a page converts visitors into leads or customers, measured through specific KPIs. The sub-sections below cover conversion rate benchmarks, essential metrics to track, and the distinction between bounce rate and exit rate.
A good landing page conversion rate is typically 10% or above, though this benchmark shifts significantly by industry, traffic source, and page goal. According to Unbounce's analysis of 464 million visits across 41,000 landing pages, the median conversion rate across all industries sits at 6.6% as of Q4 2024.
Device type creates a significant gap. Desktop conversion rates average 3.5% to 4.0%, while mobile trails at 1.8% to 2.5%. Several factors push rates higher:
Any page consistently exceeding 10% is outperforming most competitors, but treating that number as a universal target misses the point. A page collecting email signups should convert far higher than one selling a $500 product.
The key performance indicators you should track for landing pages extend well beyond conversion rate alone. A complete measurement framework includes metrics that reveal where visitors engage, hesitate, and drop off.
Essential landing page KPIs include:
Tracking these KPIs together reveals the full story. A high bounce rate paired with strong conversion rate among remaining visitors, for instance, points to a traffic quality issue rather than a page design problem.
Bounce rate and exit rate differ on landing pages in what each metric measures about visitor behavior. Bounce rate captures the percentage of visitors who land on a page and leave without any interaction, not a click, scroll event, or navigation to another page. Exit rate measures the percentage of all pageviews where that page was the last one viewed in a session, regardless of how many pages the visitor saw beforehand.
On a landing page, a high bounce rate signals that visitors are not finding what they expected. This often points to message mismatch between the ad or search result and the page content. A high exit rate, by contrast, is sometimes expected; if the page's goal is a single conversion action, visitors naturally exit after completing it.
According to a Growth Engines report, mobile drives 77% of ecommerce traffic but converts at roughly half the desktop rate. This gap makes device-segmented bounce rate analysis especially important, since mobile visitors abandon pages more frequently due to slow load times or poor tap targets.
Distinguishing between these two metrics prevents misdiagnosis. With clear KPIs established, the next step is optimizing the elements visitors see first: your headline and copy.
Headline and copy optimization improves conversions by aligning page messaging with visitor intent, reducing friction between arrival and action. The sections below cover compelling headlines, scannable body copy, and choosing between long-form and short-form content.
A landing page headline is compelling when it communicates a clear, specific benefit that matches the visitor's intent within seconds. Strong headlines use concrete language, address a single pain point, and create immediate relevance.
Effective headlines share several traits:
Because the headline is the first element most visitors read, even small wording changes can meaningfully shift whether someone stays or bounces.
You should structure body copy for scannability by breaking content into short, visually distinct blocks that let visitors find key information without reading every word. Most visitors scan rather than read linearly; formatting must accommodate that behavior.
Key structural techniques include:
For brands processing high traffic volumes, scannable copy reduces cognitive load and keeps visitors moving toward the call to action.
You should use long-form copy when the offer requires significant commitment, explanation, or trust-building, and short-form copy when the action is simple and the audience already understands the value.
The decision depends on three factors:
There is no universal rule. A/B testing both lengths against the same audience reveals which format drives higher conversion rates for a specific page and offer type.
With copy length and structure defined, visual design determines how effectively that content guides visitors toward action.
Visual design plays a direct role in landing page performance by controlling where visitors look, what they engage with, and whether they convert. The following sections cover visual hierarchy, media formats, and whitespace.
Visual hierarchy guides visitor attention by arranging size, contrast, color, and positioning to prioritize the most important elements on a page. Larger headlines draw the eye first, followed by supporting images, then body copy and calls to action. High-contrast CTA buttons placed against neutral backgrounds create a natural focal point that directs clicks.
Effective hierarchy follows natural reading patterns. According to Nielsen Norman Group, the F-shaped scanning pattern remains prevalent on both desktop and mobile, with first lines of text and the leftmost words on each line receiving the most visual fixations. Designing with this pattern in mind means placing key messages and CTAs along those high-attention zones. When hierarchy is weak or absent, visitors scan randomly and leave without completing the desired action.
The image and video formats that convert best on landing pages are those that load quickly, reinforce the value proposition, and create visual contrast around the CTA. Product images showing the item in context outperform generic stock photography because they reduce uncertainty for the buyer. Short-form video, typically under 60 seconds, holds attention longer than static images when explaining a product or demonstrating a use case.
Color choices around conversion elements also matter. According to a CXL study by Ed Leake analyzing 90 high-converting CTA buttons, orange, blue, red, and green are the most popular colors among top-performing designs. Choosing media formats that compress well, such as WebP for images and MP4 for video, keeps visual quality high without degrading page speed.
Whitespace influences readability and engagement by reducing cognitive load and directing focus toward key content. Generous spacing between paragraphs, around images, and surrounding CTAs makes each element easier to process. Without adequate whitespace, pages feel cluttered, which increases bounce rates and discourages scrolling.
Whitespace also reinforces visual hierarchy. Padding around a CTA button isolates it from surrounding text, making the action step unmistakable. For landing pages specifically, this is one of the most underestimated design levers; adding breathing room between sections often improves engagement more than adding new content does.
With visual design principles established, the next step is crafting CTAs that turn that attention into action.
You create calls to action that convert by optimizing three elements: placement, visual design, and copy wording. The sections below cover where to position CTAs, which colors and sizes perform best, and how specific word choices influence click-through rates.
You should place CTAs above the fold as the primary position, with supporting CTAs repeated after key content sections. According to Flint, CTAs above the fold can increase conversions by up to 304% compared to CTAs placed lower on the page. This makes the hero section the single highest-leverage location for your primary action button.
However, a single above-the-fold CTA rarely captures every visitor. Repeating the CTA after benefit sections, testimonials, or pricing breakdowns catches users who need more information before committing. A/B testing CTA placement alongside headlines and forms is where the biggest conversion gains typically surface, so treat position as a variable rather than a fixed decision.
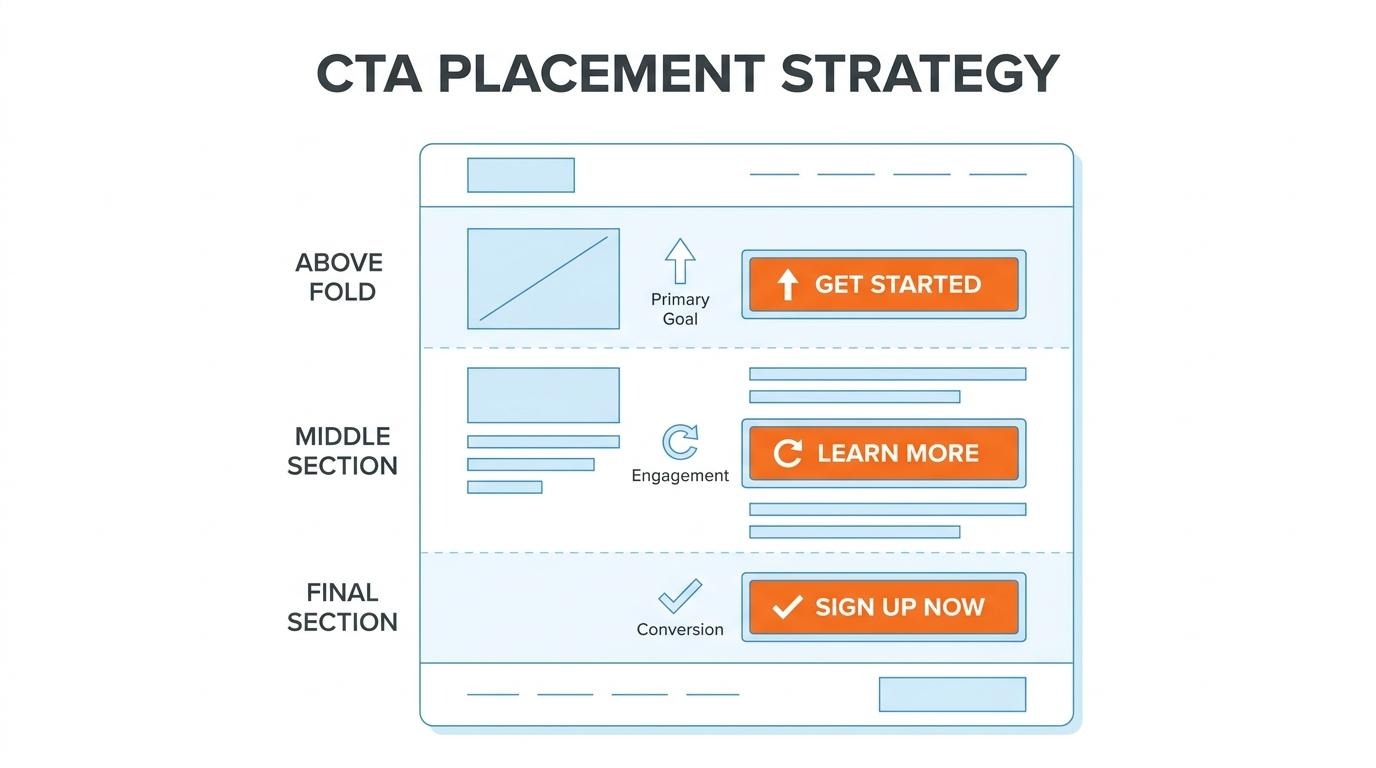
CTA button colors and sizes drive more clicks when they create strong visual contrast against the page background. High-contrast colors like red, orange, and green consistently outperform muted alternatives because they interrupt scanning behavior and draw the eye to the action point.
Size matters for tap targets, especially on mobile. Buttons should be large enough to tap comfortably (at least 44x44 pixels) without dominating the layout. According to a LinkedIn post by Hernan Tabah on 2025 marketing trends, 80% of consumers are more likely to purchase when experiences are personalized, which extends to dynamically matching CTA color and size to user segments. The real lesson here is that no single color "wins" universally; what matters is contrast ratio relative to your specific page design.
CTA copy wording affects click-through rates by setting clear expectations for what happens after the click. Vague labels like "Submit" or "Click Here" create hesitation because they fail to communicate value.
Effective CTA copy follows two principles:
First-person framing ("Start My Trial") often outperforms second-person ("Start Your Trial") because it reinforces ownership of the outcome. For most landing pages, specificity in CTA copy is the cheapest conversion lever available, yet it remains one of the most undertested elements.
With CTA strategy refined, consistent testing ensures these choices hold up across changing audience segments and traffic sources.
Page speed optimization improves landing page results by reducing load times that directly erode conversions. The subsections below cover server response time, image compression, and lazy loading.
You reduce server response time for landing pages by optimizing the backend infrastructure that processes each visitor request. Time to First Byte (TTFB) measures how quickly a server begins delivering content after a browser sends a request, and high TTFB delays every subsequent resource load.
Key techniques for lowering server response time include:
According to Akamai, a 100-millisecond delay in load time drops conversion rates by 7%. For landing pages running paid traffic, even small TTFB improvements translate directly into lower cost per acquisition.
Image compression techniques that speed up load times fall into two categories: lossy and lossless compression. Lossy compression, used in formats like WebP and AVIF, removes non-essential visual data to achieve smaller file sizes with minimal perceptible quality loss. Lossless compression, common in optimized PNGs, reduces file size without discarding any pixel data.
Practical steps for image optimization include:
Since images typically account for the largest portion of page weight, compression is often the single highest-impact speed improvement available.
Lazy loading affects above-the-fold performance by deferring the download of offscreen images and media until a user scrolls near them. This prioritizes bandwidth for the content visitors see first, directly improving Largest Contentful Paint (LCP). According to Google Search Central, LCP should occur within 2.5 seconds to provide a good user experience.
However, lazy loading must be applied selectively. Hero images, primary CTAs, and any visual element visible on initial load should never be lazy-loaded; doing so delays the very content that determines first impressions. Only offscreen assets, such as testimonial sections, footer images, or below-fold galleries, should receive the loading="lazy" attribute.
When implemented correctly, lazy loading reduces initial page weight without sacrificing the visual completeness visitors expect the instant a landing page renders. With speed fundamentals addressed, testing specific page elements reveals which optimizations yield the highest conversion gains.
A/B testing strategies improve landing page performance by isolating individual variables, running tests long enough for statistical validity, and interpreting results against confidence thresholds. The subsections below cover which elements to prioritize, how long tests need to run, and how to read results accurately.
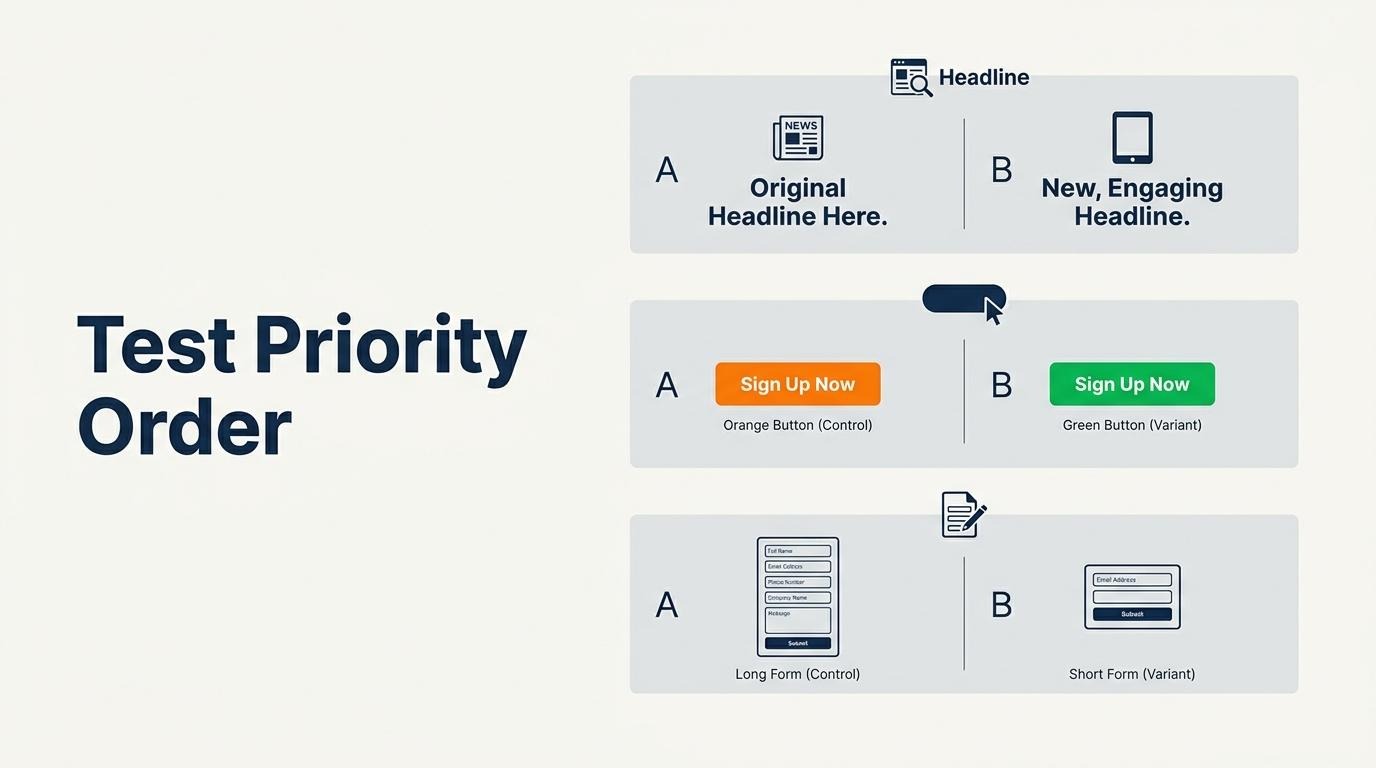
The landing page elements you should test first are headlines, CTAs, and forms, since these directly control where conversions happen. According to Replo, beginners should run simple A/B tests with just two versions, test single elements to isolate impact, and commit to full 2-4 week test durations.
A practical testing sequence includes:
Testing high-impact elements first generates the clearest performance signals before moving to subtler layout or copy variations.
You should run an A/B test for a minimum of two to four weeks to collect valid results. Shorter tests risk capturing day-of-week fluctuations, seasonal anomalies, or insufficient sample sizes that produce misleading winners.
The accepted standard for statistical significance in A/B testing is 95% confidence, corresponding to a Z-score of 1.96. A page converting at 2-5% typically needs 1,000 to 2,000 conversions per variant to detect a 10-20% relative lift at that threshold. Low-traffic pages may need even longer durations. Ending a test early because one variant "looks" ahead is one of the most common mistakes in conversion optimization; patience with test duration protects against false positives.
You interpret split test results accurately by evaluating statistical significance, effect size, and segment-level performance together. A variant that reaches 95% confidence with a meaningful conversion lift is a reliable winner.
Key interpretation steps include:
Treating A/B testing as a continuous discipline, rather than a one-time project, compounds incremental gains into substantial long-term conversion improvements. With validated test results in hand, the next step is targeting those optimizations to specific audience segments.
Audience segmentation strengthens landing pages by matching page content, offers, and messaging to distinct visitor groups. The following subsections cover personalization by traffic source, new versus returning visitor strategies, and geographic targeting adjustments.
You personalize landing pages by traffic source by adjusting headlines, offers, and page layouts to match the intent behind each channel. A visitor arriving from a paid search ad expects the exact promise from that ad, while someone clicking through from an organic social post may need more context before converting.
According to Markana Media, personalized landing pages outperform generic ones by 20–40% on average. Device context matters too; with mobile devices accounting for 51.48% of global website traffic in Q2 2026, traffic-source personalization must account for screen size and interaction patterns alongside referral channel. For most ecommerce brands, tailoring even the headline and hero image per source is the highest-leverage starting point before testing deeper layout changes.
What changes when you segment by new versus returning visitors is the depth of trust and product familiarity each group requires. New visitors need educational content, social proof, and clear value propositions because they have no prior relationship with your brand. Returning visitors already understand the offer, so they respond better to loyalty incentives, personalized product recommendations, and streamlined checkout paths.
According to Alexander Jarvis, returning customers convert at 3.5–4.5% compared to 2.5% for new visitors, with an ideal site composition of roughly 70% returning and 30% new. Treating both groups identically wastes the trust equity you have already built with repeat visitors while simultaneously overwhelming first-time arrivals with assumptions they are not ready for.
Geographic targeting affects landing page messaging by aligning language, imagery, currency, and offers with a visitor's location. Shoppers in different regions respond to localized shipping timelines, region-specific promotions, and culturally relevant visuals that generic pages cannot provide.
Practical geographic adjustments include:
Even simple localization, like swapping a zip-code reference for the visitor's city name, signals relevance and reduces the cognitive gap between ad click and conversion. With segmentation strategies refined, trust signals and social proof further reinforce the credibility each audience segment needs.
Trust signals and social proof increase conversions by reducing perceived risk and validating purchase decisions through third-party evidence. The subsections below cover the most effective social proof types, optimal placement for testimonials and reviews, and the conversion impact of security badges at checkout.
The types of social proof that work best on landing pages are customer reviews, testimonials, user-generated content, real-time activity notifications, and expert endorsements. Each type reduces buyer hesitation in a different way.
The most effective formats include:
According to a study by the Medill Spiegel Research Center at Northwestern University, when reviews were displayed for a lower-priced product, the conversion rate increased 190%. Volume matters as well; even a single review begins shifting buyer confidence. For most landing pages, combining two or three of these formats yields stronger results than relying on any single type alone.
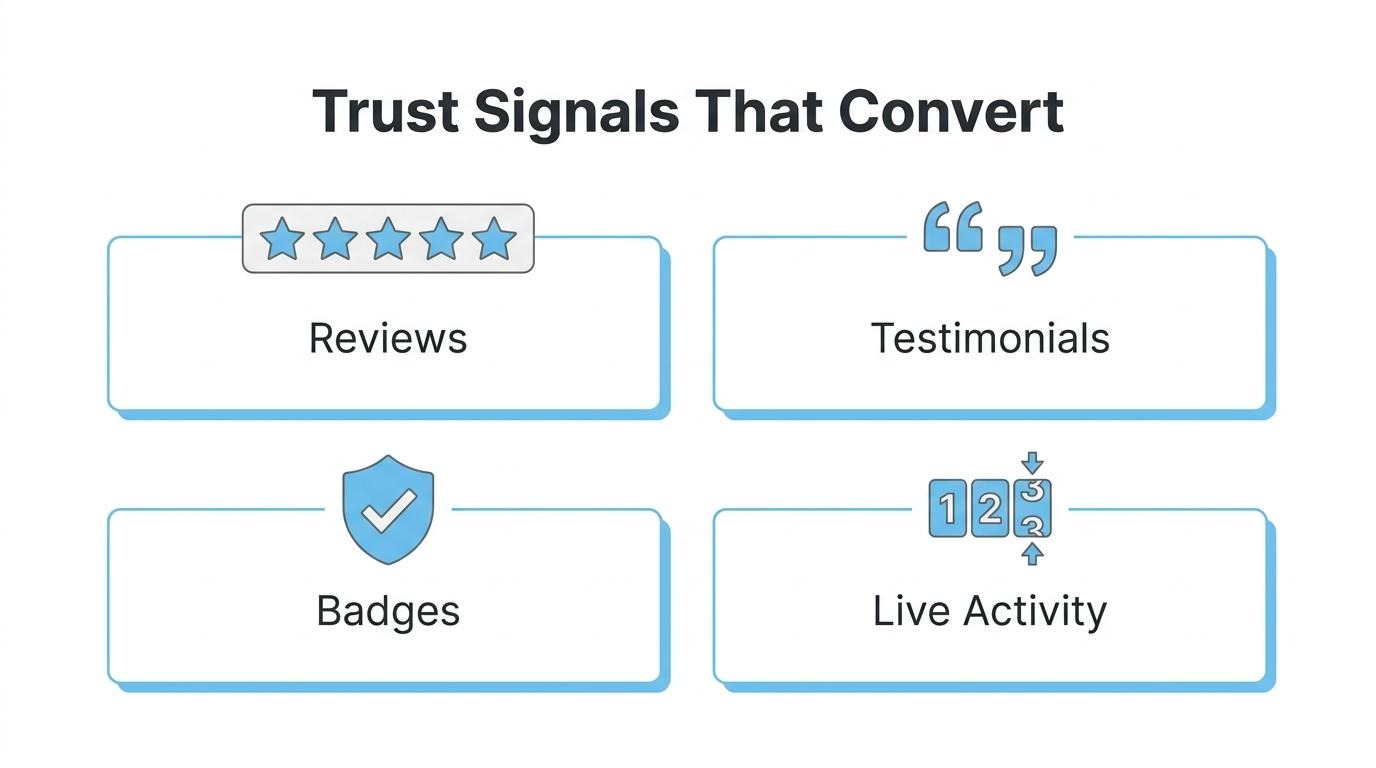
You should place testimonials and reviews near the decision points where visitors weigh whether to act, specifically close to CTAs, pricing sections, and form fields.
Effective placement positions include:
According to PowerReviews, when a shopper is exposed to a product page with one or more reviews, conversion lifts by 52.2%. Placing reviews where hesitation peaks, rather than burying them in a dedicated section at the page bottom, captures this lift when it matters most.
Security badges affect checkout landing pages by reducing trust friction during the most risk-sensitive step of the purchase process. Shoppers who reach checkout have already decided to buy; visible security indicators prevent last-second abandonment.
Key badge types that influence checkout conversions include:
According to Baymard, checkout optimization focused purely on removing trust friction can deliver a 35% uplift in conversion rate. Badge placement works best directly beside payment fields and the final purchase button, where anxiety about data security is highest. Poorly designed or unfamiliar badges, however, can have the opposite effect; only use recognizable, verifiable seals.
With trust signals in place across the page, optimizing form fields becomes the next lever for capturing more completions.
You optimize landing page forms for higher submissions by reducing field count, collecting data gradually, and validating entries in real time. The sections below cover ideal field quantity, progressive profiling, and inline validation.
A landing page should include only the fields essential to the conversion goal, typically three to five. According to HubSpot, each additional form field decreases the conversion rate by an average of 4.1%. That penalty compounds quickly; a ten-field form can cut submissions nearly in half compared to a four-field version.
The safest starting point for most lead-generation pages is name, email, and one qualifying question. Ecommerce checkout forms may require more fields, but grouping them into logical steps (contact, shipping, payment) reduces perceived friction. For brands already managing complex data across tools, over-qualifying at the form stage is one of the most common and expensive mistakes to avoid.
Progressive profiling is a data-gathering technique that collects visitor information gradually across multiple interactions rather than in a single form. As Ping Identity describes, the method builds a robust customer profile of everyone who joins a list through incremental collection over time.
You should use progressive profiling when your sales cycle requires rich lead data but your initial conversion page cannot support more than a few fields. Instead of asking for job title, company size, and budget on the first visit, the form remembers what a returning visitor already provided and surfaces new questions. This approach keeps early forms short while still enriching records over subsequent touchpoints. Transparency about how data will be used is essential for maintaining trust throughout the process.
Inline validation reduces form abandonment by alerting users to input errors the moment they occur, rather than after submission. According to BuildGrowScale, inline form validation implemented correctly reduces form abandonment by 16% and cuts completion time by 22% when errors display on blur events.
Without real-time feedback, visitors complete an entire form only to encounter a generic error message at submission, which is often enough to trigger abandonment. Given that form abandonment rates range from 67% to 81% across industries, even a modest reduction has meaningful impact on total submissions. Effective inline validation includes three core behaviors:
From a practical standpoint, inline validation is one of the highest-return, lowest-effort form optimizations available; it requires minimal development yet directly addresses the single largest drop-off point in any lead capture flow. With form friction minimized, the next consideration is how search visibility drives qualified traffic to these optimized pages.
SEO affects landing page traffic and performance by determining how visible a page is in organic search results, which directly controls the volume and quality of visitors arriving without paid ads. The subsections below cover how organic search drives qualified traffic, why keyword alignment shapes relevance, and what role Core Web Vitals play in rankings.
Organic search drives qualified traffic to landing pages by matching user search intent with page content, delivering visitors who are actively seeking what the page offers. Unlike paid channels where traffic stops when budgets run out, organic rankings compound over time. Pages that rank for specific, intent-rich queries attract visitors already in a decision-making mindset, which naturally produces higher engagement and lower bounce rates. According to a 2024 Unbounce analysis of 464 million visits across 41,000 unique landing pages, the median conversion rate across all industries sits at 6.6%. Pages optimized for the right organic keywords consistently outperform those relying solely on broad paid traffic because visitor intent is pre-qualified by the search query itself.
Keyword alignment between ads, search, and landing pages matters because it creates message consistency that search engines and users both reward. When the target keyword appears naturally in the page title, H1 heading, meta description, and body copy, Google recognizes strong topical relevance and ranks the page higher for that query. This same alignment improves Quality Score in paid campaigns. According to research cited by Moz, each 1-point increase in Quality Score reduces cost per conversion by 13%. Mismatched keywords between an ad and its destination page create dissonance; visitors bounce because the content does not match their expectation. Consistent keyword threading from search query through ad copy to landing page headline is one of the simplest ways to improve both organic visibility and paid efficiency simultaneously.
Core Web Vitals influence landing page rankings by serving as Google's measurable thresholds for user experience quality. Google Search Central defines three specific metrics:
Pages meeting all three thresholds receive a ranking signal boost in Google's algorithm, while pages failing them face potential demotion. These metrics matter beyond rankings, though. A slow LCP means visitors see a blank screen; high CLS means buttons shift mid-click. Both behaviors increase bounce rates and destroy conversion potential before the page content even has a chance to persuade.
With organic visibility secured, aligning landing pages with paid campaigns amplifies total performance.
You align landing pages with paid ad campaigns by matching the ad's promise to the page's headline, offer, and visual design. This consistency, called message match, improves Quality Score and reduces wasted ad spend. The subsections below cover message match mechanics, Quality Score impact, and dynamic content strategies.
Message match is the degree of alignment between a paid ad's copy and the landing page a visitor sees after clicking. Strong message match means the headline, offer language, and imagery on the landing page directly reflect what the ad promised. When visitors land on a page that echoes the exact phrasing they clicked, cognitive friction drops and trust builds immediately.
Poor message match creates a disconnect. A visitor who clicks an ad for "free shipping on running shoes" but lands on a generic footwear category page will bounce. According to a study published in Management Science Journal, an increase in landing page quality scores is associated with improved advertising performance and reduced costs. Maintaining tight alignment between ad copy and landing page content is one of the simplest ways to protect both budget and conversion rate.
Landing page experience affects Quality Score by influencing how Google rates the relevance and usability of your post-click destination. Quality Score evaluates three components: expected click-through rate, ad relevance, and landing page experience. A low landing page experience score signals that the page content does not match what the ad promised, or that usability issues (slow load times, poor mobile layout, confusing navigation) degrade the visitor's experience.
Each 1-point increase in Quality Score reduces cost per conversion by 13%, according to data cited by Moz. Faster load speeds, clear headline-to-ad alignment, and mobile responsiveness all contribute to a higher landing page experience rating. Improving this single factor compounds savings across every click in a campaign.
You use dynamic text replacement by automatically swapping headline or body text on a landing page to match the specific keyword or ad copy that triggered the click. Instead of building dozens of static pages for each ad variation, one template page updates its text dynamically based on URL parameters passed from the ad platform.
For example, an ad targeting "organic protein powder" and another targeting "plant-based protein shake" can both direct to the same landing page. Dynamic text replacement inserts the matching phrase into the headline so each visitor sees language consistent with what they searched. This technique scales message match across large keyword sets without requiring separate page builds for every ad group.
With ad-to-page alignment handled, the next step is identifying which landing page mistakes silently erode the conversions you have worked to earn.
The landing page mistakes that hurt conversion rates most include slow page load times, over-qualified forms, poor mobile experiences, weak calls to action, and missing trust signals. With the median conversion rate sitting at just 6.6%, most businesses lose significant revenue through preventable design errors.
According to Portent, the highest e-commerce conversion rates occur between 1 and 2 seconds of load time, averaging 3.05% at 1 second and dropping to just 0.67% at 4 seconds. That steep decline makes slow pages one of the costliest mistakes a brand can make, yet it remains one of the easiest to overlook during design reviews.
The most damaging mistakes fall into a few categories:
From an optimization standpoint, the highest-impact fix is almost always speed. No amount of copy refinement or design polish compensates for a page that loads in four or five seconds. After speed, reducing form friction and strengthening above-the-fold clarity tend to deliver the next biggest gains. When customer data is scattered across disconnected tools, even diagnosing which mistakes matter most becomes difficult.
You approach landing page performance by unifying customer data into a single system that informs personalization, segmentation, and conversion optimization. The subsections below cover how a shared CRM and landing page system changes personalization, followed by key takeaways for improving performance overall.
Landing page personalization and CRM sharing one system in SHOPLINE eliminates the data sync gaps that fragment customer insights across separate tools. When purchase history, browsing behavior, and lifecycle stage live alongside the landing page builder, segmentation becomes immediate rather than delayed by API lag or manual exports.
According to Dialpad, implementing CRM integration brings all customer data into one unified view, which helps teams work more efficiently and make better decisions. SHOPLINE’s customer segments help merchants plan targeted offers for new and returning customers. Dynamic landing page personalization depends on the tools and configuration in use. For brands running at scale, this consolidation removes one of the most common bottlenecks in personalization workflows.
The key takeaways about improving landing page performance center on speed, clarity, testing, and data-driven personalization.
The brands that improve fastest treat landing pages as living assets, continuously tested and refined with real customer data rather than assumptions. Results may vary depending on implementation, industry, and scale.