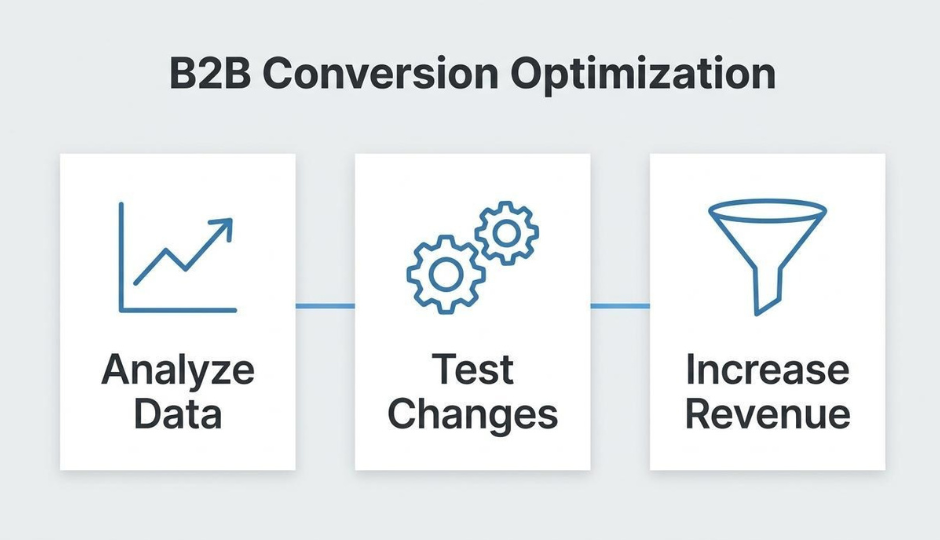
B2B conversion rate optimization is the systematic process of increasing the percentage of prospects who complete desired actions on your website or landing pages, with the goal of generating qualified leads and accelerating revenue through longer, multi-stakeholder buying cycles.
This guide covers what separates B2B from B2C conversion optimization, benchmark rates across channels and industries, proven CRO strategies, sales funnel alignment, testing and metrics, and the role unified data plays in sustained conversion gains.
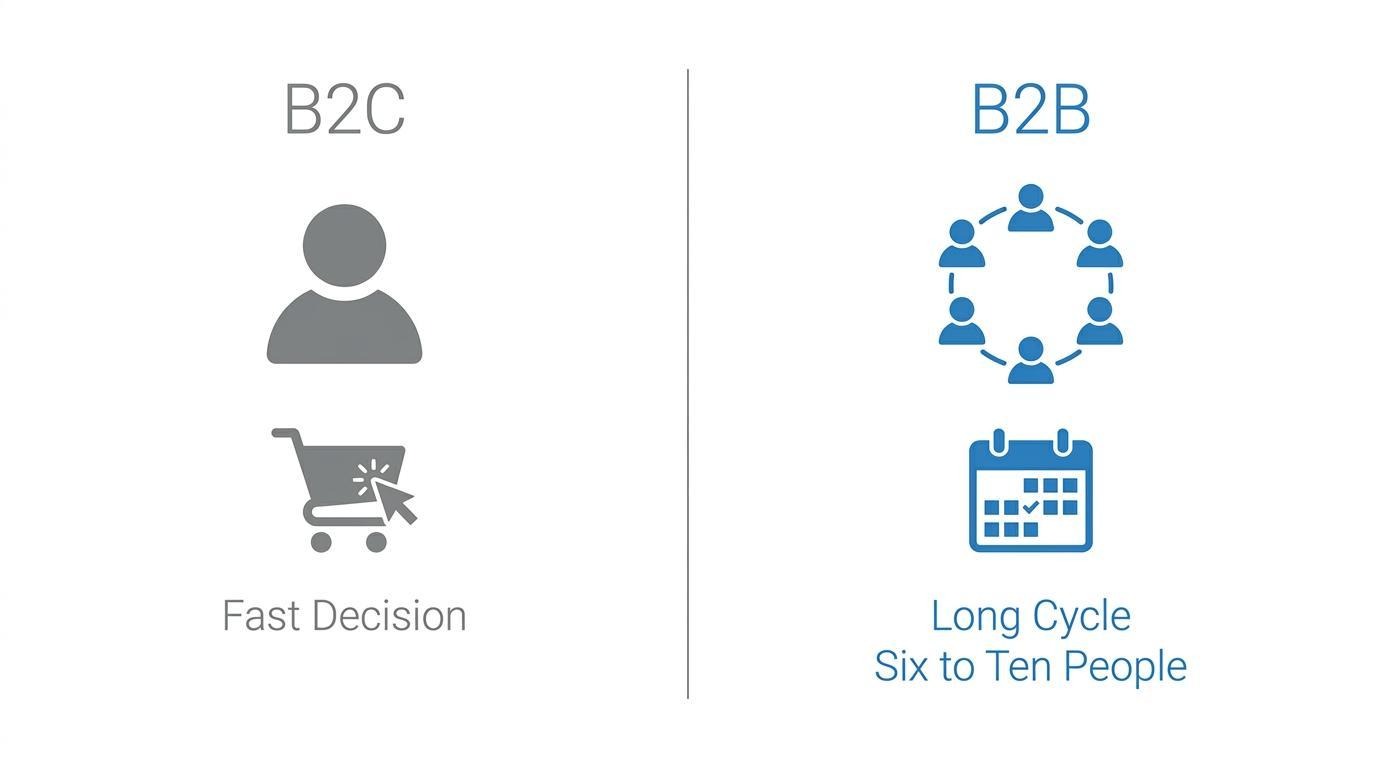
B2B buying cycles involve 6 to 10 stakeholders over 3 to 6 months, which means conversion actions like demo requests, quote submissions, and free trial signups replace one-click purchases. We break down how these structural differences shape every optimization decision.
Benchmark rates vary widely depending on channel and conversion type. B2B landing pages convert 2 to 5% of visitors on average, wholesale ecommerce falls between 1.8% and 3.1%, and paid search averages 3.5%. We cover what "good" looks like for SaaS, wholesale, lead generation forms, and email campaigns so you can measure against the right standard.
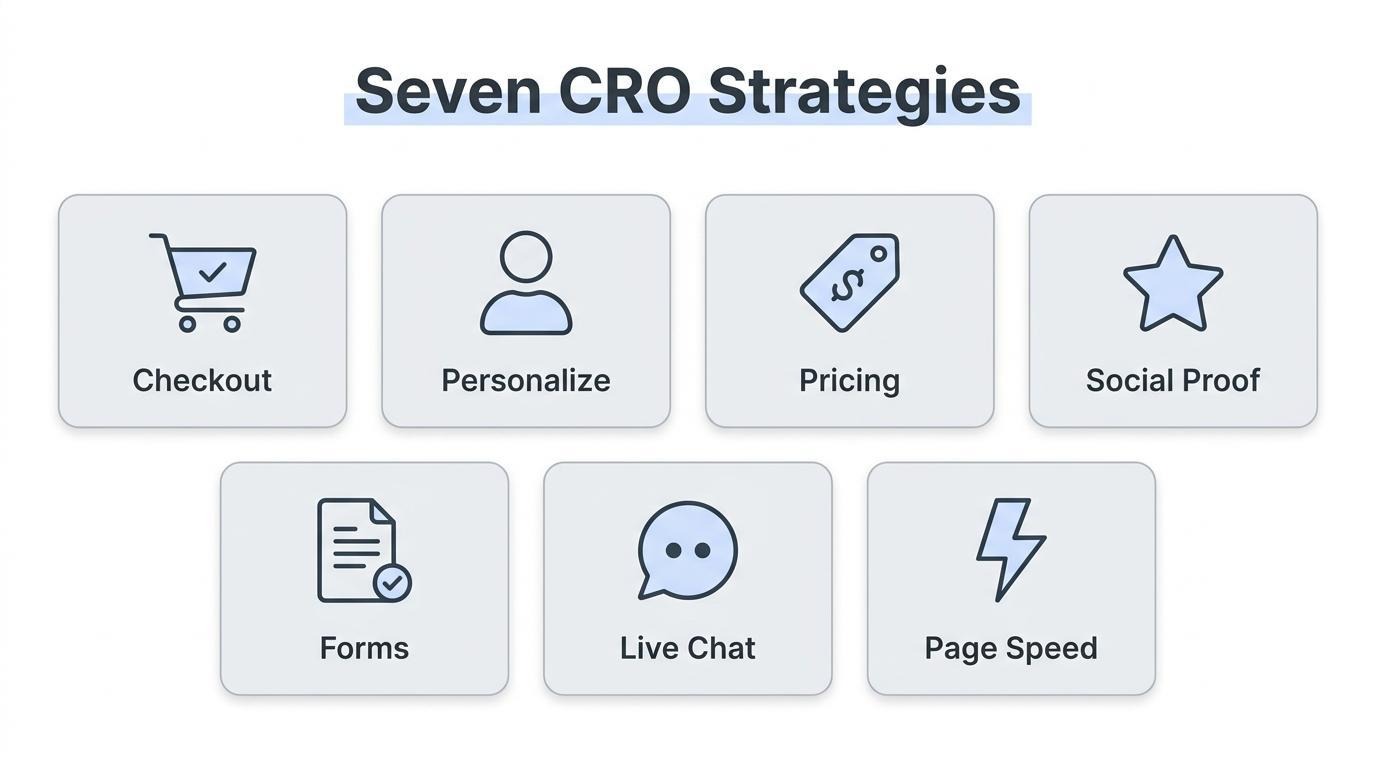
The core CRO strategies we examine include checkout simplification, account-based personalization, tiered pricing, social proof placement, streamlined quote forms, live chat, and page speed optimization. Each targets specific friction points across the buyer journey rather than isolated page elements.
We also walk through how to align tactics to each sales funnel stage, run A/B tests in low-traffic B2B environments, and track metrics like MQL-to-SQL and SQL-to-closed-won rates that actually predict revenue.
Finally, we explore how fragmented data across disconnected tools slows optimization cycles, erodes reporting trust, and quietly degrades lead quality. Consolidating commerce, CRM, and customer data onto a unified platform eliminates these gaps and enables faster, cleaner conversion improvements.
B2B conversion rate optimization differs from B2C because B2B purchases involve longer sales cycles, multiple decision-makers, and higher order values that demand trust-building over immediate transactions. The key differences span buyer psychology, conversion definitions, and site performance requirements.
B2B buying committees typically include 6 to 10 stakeholders evaluating a purchase over 3 to 6 months. That consensus-driven process means conversion actions look different: demo requests, quote forms, and free trial sign-ups replace one-click purchases. Success metrics shift accordingly, prioritizing lead quality, sales cycle length, and customer lifetime value over raw conversion volume.
Site experience carries outsized weight in this extended evaluation. According to Portent's research, a B2B site that loads in 1 second converts at 5x the rate of one that loads in 10 seconds, illustrating how technical performance compounds across multiple stakeholder visits during a single deal cycle.
The tools that accelerate B2B conversions also reflect this relationship-first model. Real-time engagement channels, such as live chat with proactive triggers, address buyer questions during research without requiring a scheduled sales call. Because B2B buyers often revisit a site multiple times before converting, each touchpoint either builds or erodes confidence.
For teams accustomed to B2C tactics like flash sales or countdown timers, the shift requires patience. Artificial urgency tends to backfire when procurement teams need internal buy-in, whereas detailed case studies, transparent pricing tiers, and responsive support reinforce the trust that moves complex deals forward. Understanding these structural differences is what separates effective B2B CRO from simply applying consumer playbook tactics to a longer funnel.
A good B2B conversion rate depends on the conversion type, industry, and channel. The sections below break down benchmarks for SaaS landing pages, wholesale ecommerce, lead generation forms, and email campaigns.
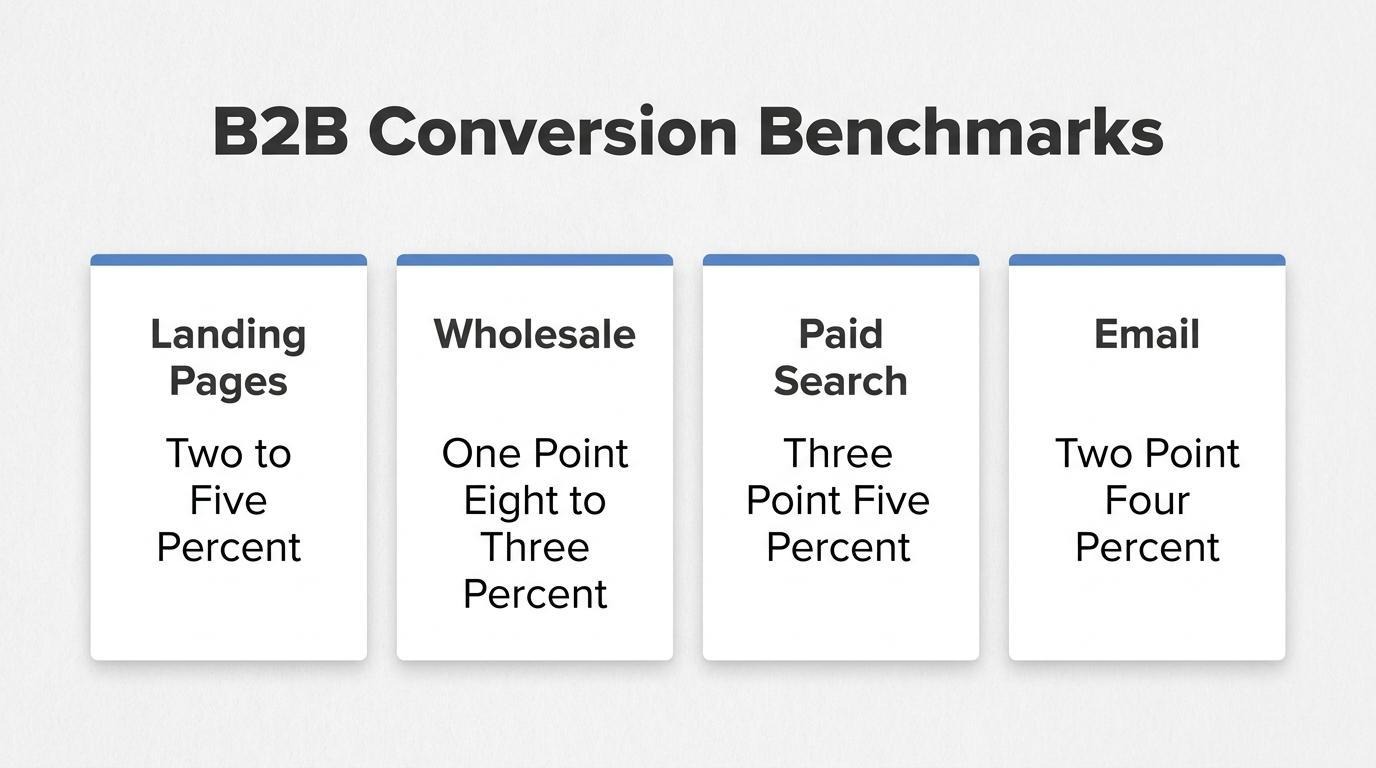
A good B2B conversion rate for SaaS landing pages is 2-5% for average performers and 8-12% for top performers. According to KISSmetrics benchmark data, the gap between these tiers often reflects traffic quality rather than page design.
Free trial conversion adds another layer. The median SaaS free trial conversion rate sits at 8%, though B2B-focused products reach 6-10% at the 50th percentile and 15-20% at the 75th. Trial-to-paid rates range from 15-25% on average; opt-out trials requiring a credit card push that to 25-35% at the median.
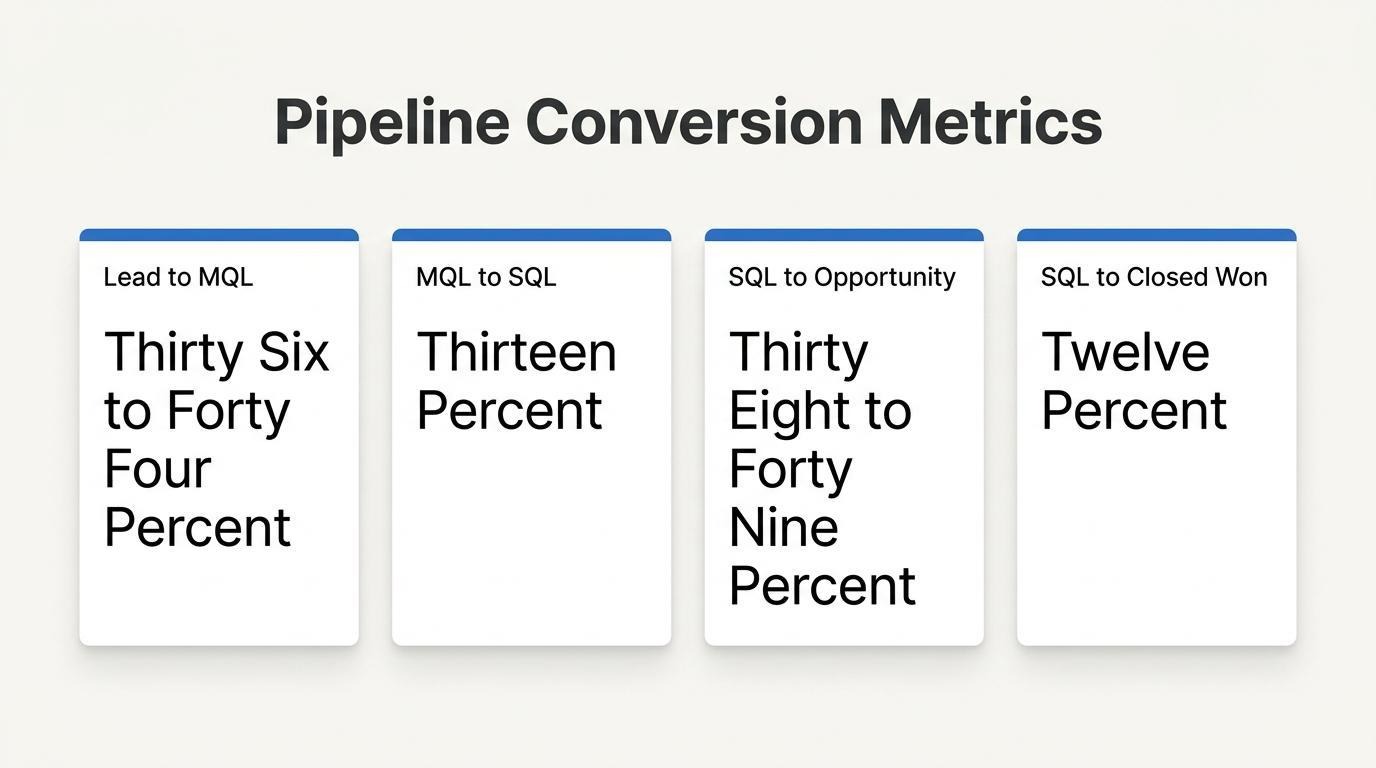
Beyond landing page metrics, the full SaaS funnel matters. Lead-to-MQL conversion runs 36-44% by channel, MQL-to-SQL averages 13%, and SQL-to-closed-won sits near 12%. Focusing only on top-of-funnel page conversion while ignoring downstream qualification often masks pipeline quality problems.
A good B2B conversion rate for wholesale ecommerce falls between 1.8% and 3.1%, depending on company size and industry vertical. According to Adobe's ecommerce benchmarks, the global ecommerce conversion rate averages 2.58%, with B2B ecommerce trending lower due to higher order values and longer consideration periods.
These lower rates are not necessarily a weakness. When average order values reach thousands of dollars and buying committees need internal approvals, a 2-3% conversion rate can represent strong revenue performance. Comparing B2B wholesale rates to B2C benchmarks without accounting for deal size misrepresents actual business impact.
A good B2B conversion rate for lead generation forms is 2-5% from paid search traffic, with an average of 3.5%. According to a Harvard Business Review study, firms that contacted leads within one hour of a query were nearly seven times as likely to reach a key decision maker compared to firms that waited longer.
Downstream conversion matters more than form submission volume. Successful B2B teams typically convert:
Adding live chat alongside forms can capture up to 40% more leads, with sub-30-second first-reply times delivering optimal results. B2B success metrics extend beyond form conversion rates to include lead quality, sales cycle length, and customer lifetime value.
A good B2B conversion rate for email campaigns is 2.4%. B2C email performs slightly higher at 2.8%, but the gap narrows when accounting for B2B's higher deal values and longer nurture sequences.
Email's strength in B2B lies less in single-send conversion and more in sustained pipeline influence across multi-touch buying cycles. For this reason, measuring email conversion in isolation undervalues its contribution to MQL generation and deal acceleration.
With benchmarks established across these channels, the next step is understanding how to calculate and track B2B conversion rates accurately.
You calculate B2B conversion rate by dividing the number of conversions by the total number of visitors, then multiplying the result by 100. According to Wall Street Prep, the formula is expressed as: (Conversions ÷ Total Visitors) × 100, where "conversions" represents the total number of users who complete a desired action. In B2B contexts, that desired action might be a demo request, a quote submission, a free trial signup, or a completed purchase order. The formula itself is simple, but choosing the right conversion event to measure is where most B2B teams stumble. Tracking demo requests and form fills separately, rather than lumping them into one number, produces far more actionable data for each funnel stage.
With the formula established, the next section covers specific strategies that move these conversion numbers higher.
The most effective B2B conversion rate optimization strategies target friction across the entire buyer journey. Key approaches include checkout simplification, account-based personalization, tiered pricing, social proof placement, streamlined forms, live chat, and page speed optimization.
Simplifying the checkout process improves B2B conversions by removing unnecessary steps that cause buyers to abandon high-value orders. B2B checkout flows often involve purchase orders, net payment terms, and multi-user approvals, so each additional field or page creates compounding drop-off risk.
Effective simplifications include:
For B2B brands processing complex orders, even small reductions in checkout steps can meaningfully lift completion rates. The goal is reducing cognitive load without sacrificing the data your fulfillment team actually needs.
Account-based personalization lifts B2B conversion rates by tailoring content, pricing, and product recommendations to specific accounts or buyer segments rather than serving generic experiences. According to a Nexoris Technologies analysis of 47 B2B engagements measured between 2025 and 2026, AI-driven personalization delivered a conversion rate lift between 15 and 25 percent.
When a returning procurement manager sees their negotiated pricing, previously ordered SKUs, and relevant case studies on login, the path to purchase shortens considerably. This approach works because B2B buyers expect the same recognition they receive from their sales rep, now reflected in the digital experience. Personalization at the account level is one of the highest-leverage CRO investments a B2B team can make.
Tiered pricing pages influence B2B buyer decisions by structuring choices around clear value comparisons, which reduces decision paralysis. When buyers see three or four tiers with distinct feature sets, they can self-select based on their organization's needs and budget.
Effective tiered pricing pages share several traits:
The anchoring effect of a premium tier also makes mid-range options feel like better value, which naturally steers volume toward higher-margin plans.
Social proof and case study placement affect conversions by reducing perceived risk at critical decision points in the buyer journey. According to ProveSource, 92% of consumers hesitate to buy when reviews are missing, and 40% avoid purchasing entirely without them.
Strategic placement matters as much as the proof itself. Position testimonials near CTAs, embed case study results on product pages, and display client logos above the fold on landing pages. For B2B specifically, quantified outcomes in case studies (revenue saved, time reduced, efficiency gained) carry more weight than generic endorsements. Buyers evaluating a six-figure purchase need evidence from similar organizations, not vague praise. Place the strongest proof closest to the conversion action.
Streamlined quote request forms reduce B2B drop-off by minimizing the effort required to initiate a sales conversation. Long forms with 10 or more fields signal bureaucracy, which drives high-intent buyers to competitors with simpler intake processes.
Key principles for reducing form abandonment include:
The balance between form length and lead quality is critical. Removing every qualifying field may increase submissions but flood your sales team with unqualified requests.
Live chat or real-time support impacts B2B conversions by answering buyer questions at the exact moment hesitation occurs. According to Blazeo, live chat can help B2B businesses capture up to 40% more leads from their website, with first-reply times around 30 seconds or less being optimal.
Proactive chat triggers on high-intent pages, such as pricing, product comparison, and checkout, generate the strongest results. When combined with CRM integration, chat agents gain immediate context about the visitor's account history and can tailor responses accordingly. For complex B2B purchases where buyers need technical clarification before committing, real-time support eliminates the delay that often kills momentum between interest and action.
Page speed optimization changes B2B conversion outcomes by directly reducing the abandonment that occurs during slow page loads. According to Portent's analysis of over 100 million page views, a B2B site that loads in 1 second achieves a conversion rate 3x higher than one loading in 5 seconds.
Despite this clear relationship, 82% of B2B pages still load in 5 seconds or less, a threshold that has remained flat since 2019 per the same Portent study. This stagnation represents a competitive advantage for teams willing to invest in performance improvements, such as image compression, code minification, CDN deployment, and server response optimization. Most B2B sites are leaving measurable conversions on the table simply because speed improvements continue to be deprioritized.
With these strategies in place, aligning them to your sales funnel stages ensures consistent optimization.
The B2B sales funnel plays a central role in conversion optimization by mapping distinct buyer stages to targeted tactics. Because B2B transactions emphasize partnership and long-term value over quick volume, each funnel stage requires its own conversion approach. The sections below cover awareness, consideration, and decision stage optimization.
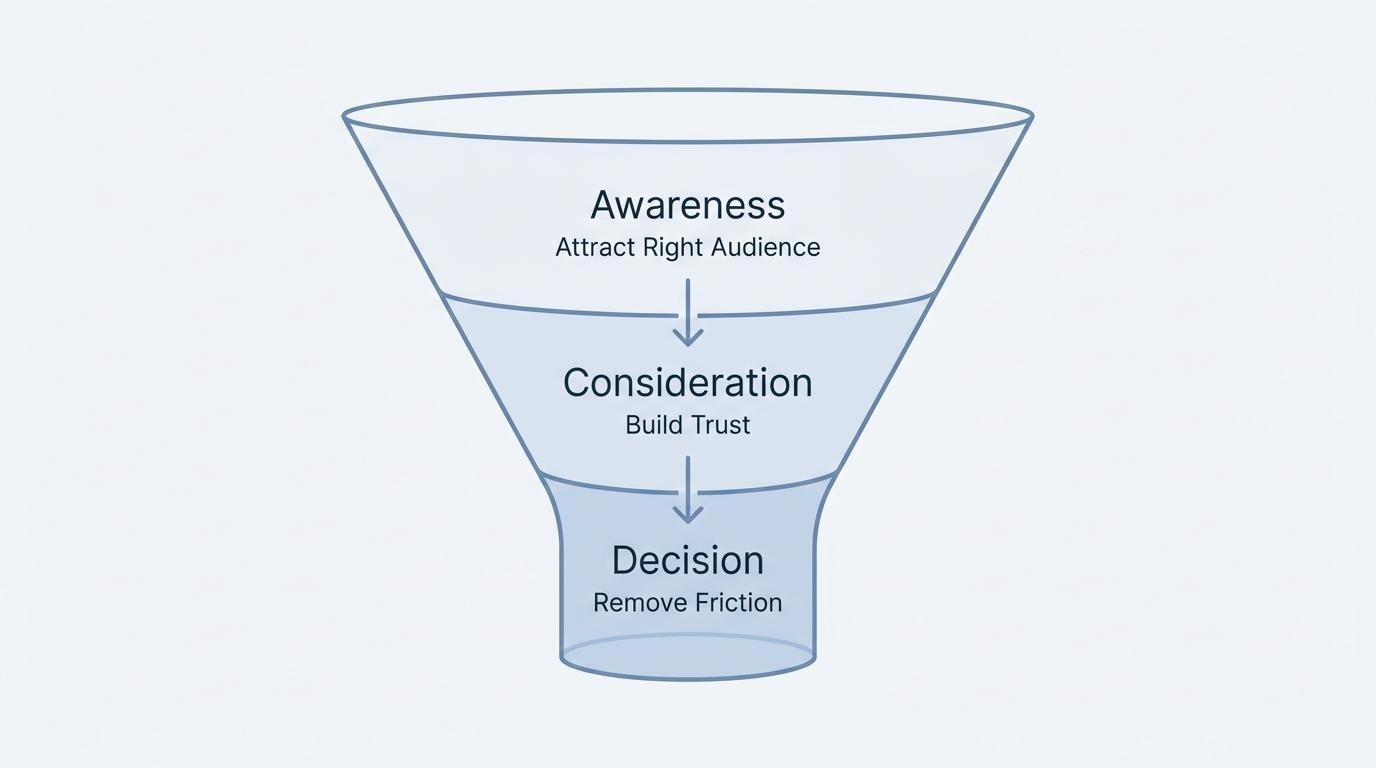
You optimize top-of-funnel awareness for B2B conversions by attracting the right audience and converting initial visits into qualified leads. At this stage, the goal is not immediate sales; it is capturing attention from prospects who match your ideal customer profile.
Effective top-of-funnel tactics include:
Filtering for quality at this stage matters more than maximizing volume. Broad awareness without ICP alignment simply inflates vanity metrics while starving the mid-funnel of viable prospects.
You improve mid-funnel consideration stage conversions by nurturing prospects with content and interactions that build trust and demonstrate clear relevance. Prospects at this stage are evaluating options, comparing vendors, and socializing decisions internally.
Key mid-funnel optimization tactics include:
According to Adience, B2B transactions are fewer but larger, emphasizing partnership and long-term value. This means mid-funnel content must build consensus across multiple stakeholders rather than push a single decision-maker toward a quick conversion.
You increase bottom-of-funnel decision stage conversions by removing friction from the final commitment and reinforcing buyer confidence. At this stage, prospects have shortlisted vendors and need clear reasons to choose one.
Effective bottom-of-funnel conversion tactics include:
The decision stage is where conversion optimization has the highest revenue impact per percentage point gained, because every lost deal at this stage represents a fully qualified opportunity that already consumed marketing and sales resources. Prioritize speed of response and personalized follow-up here above all else.
With funnel-stage tactics defined, systematic testing helps validate which changes produce measurable conversion gains.
You run A/B tests for B2B conversion rate optimization by isolating a single variable, splitting traffic between a control and variant, and waiting for statistical significance before declaring a winner. The challenge is that B2B's lower traffic volumes and longer sales cycles demand adapted methodologies compared to B2C testing.
According to Spike AI, a B2B site with a 2% baseline conversion rate and 5,000 monthly visitors needs to run a test for nearly 12 weeks to detect a 20% relative lift with 95% confidence. That timeline forces teams to be selective about what they test.
Because sample sizes accumulate slowly, prioritization matters more than velocity. Focus each test on high-impact pages, such as pricing pages, demo request forms, or checkout flows, where even small conversion lifts translate into significant revenue.
Resist the urge to check results daily. A test designed for 95% confidence that gets reviewed every day for two weeks can see its false positive rate inflate to nearly 30%, turning roughly one in four "winners" into statistical noise. Set your sample size in advance, let the test run to completion, and only then evaluate.
For sites that lack sufficient traffic for traditional split tests, consider these alternatives:
Most importantly, measure A/B test outcomes against pipeline quality, not just form submissions. A variant that generates more leads but fewer qualified opportunities wastes sales capacity. Tie test results back to metrics like MQL-to-SQL conversion and opportunity creation to ensure winning variants actually improve revenue outcomes.
With testing frameworks in place, tracking the right conversion metrics ensures each experiment drives meaningful results.
The B2B conversion rate metrics you should track span the full pipeline, from initial lead capture through closed revenue. Key metrics include lead-to-MQL conversion rate, MQL-to-SQL conversion rate, SQL-to-opportunity conversion rate, and SQL-to-closed-won rate.
According to First Page Sage's benchmark study of client data gathered from 2019 to 2025 across 25+ industries, the average MQL-to-SQL conversion rate for B2B SaaS is 13%. That single number reveals how much pipeline volume compresses at each stage: 100 MQLs at a 13% MQL-to-SQL rate produce roughly 13 SQLs, 5 to 6 opportunities, and one to two closed deals.
The core B2B conversion rate metrics to monitor are:
Most teams fixate on top-of-funnel volume, but the metrics that actually predict revenue live deeper in the pipeline. Tracking conversion rates at each handoff point exposes exactly where deals stall, whether the problem is lead quality, sales follow-up speed, or misaligned qualification criteria. Understanding these metrics sets the foundation for identifying where CRM and customer data integration can close the gaps between stages.
CRM and customer data integration affects B2B conversions by connecting lead behavior, sales activity, and marketing touchpoints into a single view that eliminates blind spots across the buying cycle. According to Chat Metrics, companies in the SaaS sector with CRM integration have seen conversion rates jump from a baseline of 2% to as high as 12%.
That kind of lift makes sense when you consider what disconnected systems actually cost. Without integration, sales teams work from incomplete records, marketing scores leads against outdated activity data, and handoffs between stages lose critical context. Each gap introduces friction that compounds across a 3-to-6-month buying cycle involving multiple stakeholders.
Integrated CRM data enables several conversion-critical capabilities:
For B2B organizations managing high-value, low-volume pipelines, the quality of data flowing between CRM and commerce systems often matters more than any single page-level optimization. A well-integrated data layer turns conversion rate optimization from a marketing exercise into an operational advantage.
Understanding how CRM integration lifts conversions also highlights what happens when that integration breaks down.
Common B2B conversion rate optimization mistakes include optimizing for MQL volume over pipeline quality, applying B2C tactics to B2B buying cycles, reducing form fields indiscriminately, and ending A/B tests prematurely due to insufficient traffic. Each of these errors compounds over time, quietly degrading lead quality and wasting sales resources.
The most damaging mistakes often look like wins on the surface. A spike in form submissions or a "winning" A/B test variant can mask deeper problems when the underlying methodology or success metric is wrong. According to Spike AI, optimizing for MQL conversion rate instead of pipeline quality is the single most expensive CRO mistake in B2B, because it systematically trades pipeline quality for volume by widening the top of the funnel without filtering for intent.
Reducing form fields is a common example of this trap. While fewer fields can produce 60% more form fills, the trade-off is often 40% fewer qualified leads, which increases sales team disqualification time and buries reps in low-intent contacts.
B2C urgency tactics create a similar mismatch. B2B buying cycles involve, on average, 6 to 10 stakeholders over 3 to 6 months; consensus-based decisions demand trust, not countdown timers. Artificial scarcity erodes the credibility that complex B2B purchases require.
A/B testing presents its own pitfalls in low-traffic B2B environments. A site with a 2% baseline conversion rate and 5,000 monthly visitors needs nearly 12 weeks to detect a 20% relative lift with 95% confidence. Most teams lack the patience, so they check results daily. When a test designed for 95% confidence is monitored every day for two weeks, its false positive rate inflates to nearly 30%, meaning roughly one in four declared "winners" are statistical noise.
The common thread across these mistakes is prioritizing surface-level metrics over downstream revenue impact. For teams running B2B conversion optimization, every test and tactic should be evaluated against pipeline quality and closed-won outcomes, not top-of-funnel volume alone. Recognizing how fragmented data across tools amplifies these errors is the next critical step.
Fragmented data across tools hurts B2B conversion rates by creating inconsistent records, eroding leadership trust, and slowing every optimization decision. The subsections below cover CRM and marketing app data gaps, offline/online tracking breakdowns, and app-stack complexity drag.
Running separate CRM and marketing apps creates data gaps by splitting customer interactions across disconnected databases, forcing manual reconciliation before any analysis can begin. Contact records diverge when one system captures a form submission while another logs an email click, and neither shares updates in real time.
According to a LayerFive analysis, fragmented marketing data costs e-commerce brands $200,000 to $850,000 annually through tool stack bloat, duplicate subscriptions, wasted analyst hours, and poor decision-making. When analysts spend the majority of their time pulling and cleaning data rather than generating insights, conversion optimization stalls. For scaling B2B teams, these gaps compound with every new tool added to the stack.
Conversion tracking breaks down when offline and online data live in different systems because no single record connects a buyer's full journey. A prospect who downloads a whitepaper online and later places a phone order generates two unlinked events. Attribution models cannot credit the original touchpoint, so marketing teams misallocate budget toward channels that appear underperforming or overperforming.
This blind spot is especially damaging in B2B, where sales cycles span months and involve multiple touchpoints across trade shows, webinars, and digital campaigns. Without a shared data layer resolving these interactions to one customer record, conversion rate calculations reflect incomplete data, and optimization efforts target the wrong friction points.
App-stack complexity slows down optimization cycles by adding layers of integration maintenance, sync delays, and vendor dependencies between every test and its results. Each additional tool introduces another API connection that can break, lag, or pass conflicting data formats.
A LayerFive report found that 51% of CTOs and Chief Data Officers do not trust their marketing platform data, with decision-making slowing significantly due to data inconsistencies across platforms. When leadership questions the numbers, approvals for landing page tests, pricing experiments, and funnel changes stall. Consolidating fragmented tools into unified solutions has been shown to improve ROI by 20 to 72% by eliminating redundancy. The faster a team can trust its data, the faster it can iterate on conversion improvements.
Understanding how fragmentation undermines CRO sets the stage for evaluating unified platform approaches.
B2B conversion optimization on a unified commerce platform starts by centralizing product data, orders, customer accounts, pricing, and inventory into a single system. This eliminates the data reconciliation bottlenecks that slow optimization cycles on fragmented stacks.
SHOPLINE handles CRO without a multi-tool app stack by consolidating commerce, CRM, marketing automation, and customer data into one platform. Instead of syncing separate tools for storefront management, email campaigns, and customer segmentation, conversion data flows through a shared system. This removes the fragile integrations and duplicate subscriptions that typically delay testing cycles. According to LayerFive, a unified platform can save $193,000 to $223,000 annually for a typical $10M revenue ecommerce brand compared to a fragmented stack, with additional revenue increases of 20 to 72% from better attribution and targeting. For B2B brands running complex pricing tiers and account-based workflows, having one customer record across online and offline channels means fewer data gaps between what marketing sees and what sales acts on. That single-system visibility is what separates fast optimization loops from the weeks-long reconciliation cycles most multi-tool setups demand.
The key takeaways about B2B conversion rate optimization center on three principles: measure what matters, reduce friction at every funnel stage, and consolidate your data.
The brands that improve B2B conversion rates most consistently are those that stop treating CRO as isolated landing page tweaks. Instead, they treat it as a system-wide discipline where every touchpoint, from first visit to reorder, runs on the same data foundation.